Kenyan vs Palestinian Single Male Poverty
COMPARE
Kenyan
Palestinian
Single Male Poverty
Single Male Poverty Comparison
Kenyans
Palestinians
12.4%
SINGLE MALE POVERTY
93.3/ 100
METRIC RATING
112th/ 347
METRIC RANK
12.7%
SINGLE MALE POVERTY
63.1/ 100
METRIC RATING
163rd/ 347
METRIC RANK
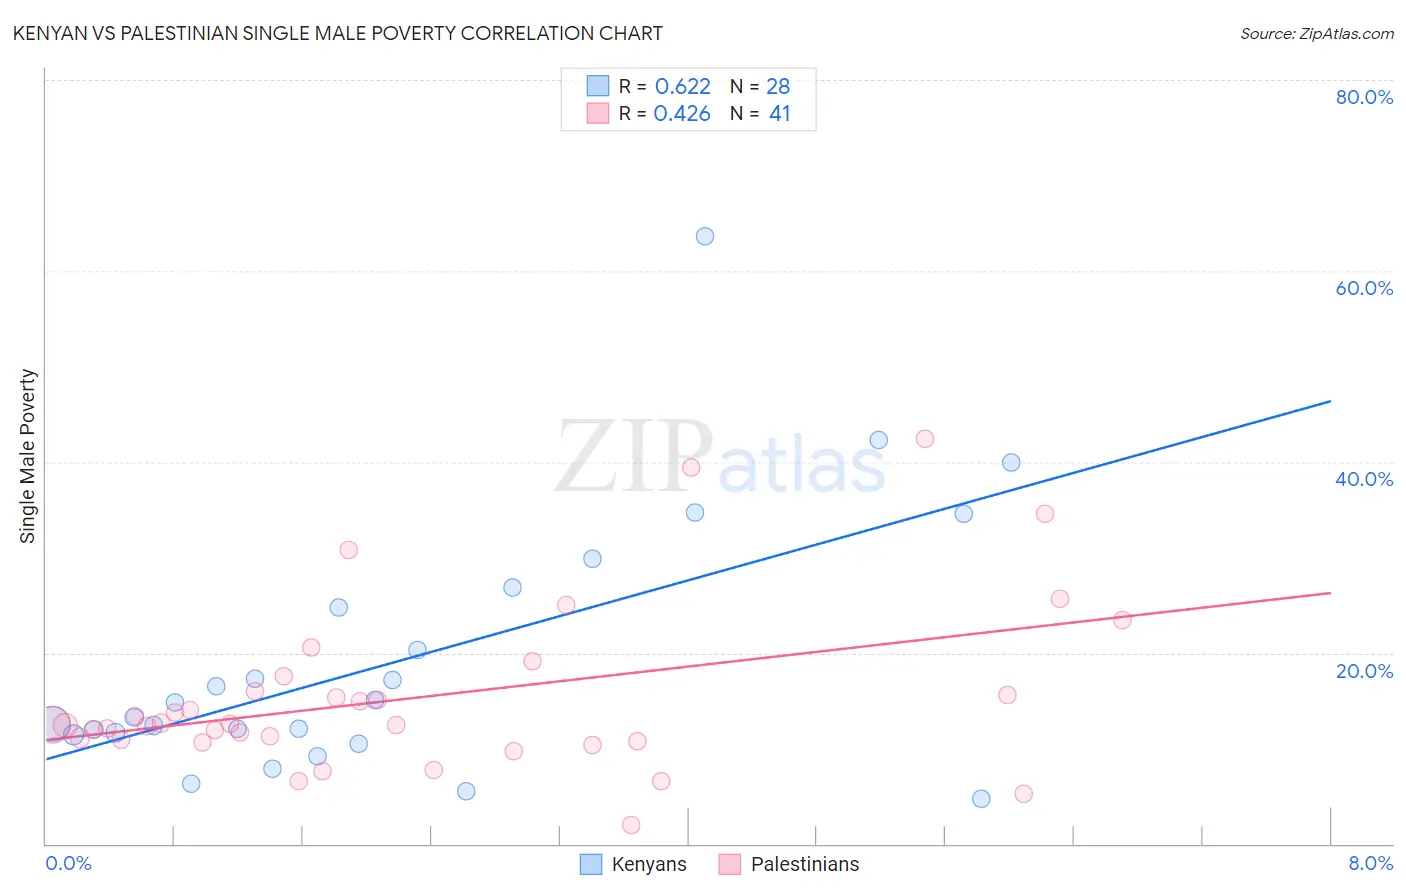
Kenyan vs Palestinian Single Male Poverty Correlation Chart
The statistical analysis conducted on geographies consisting of 158,530,419 people shows a significant positive correlation between the proportion of Kenyans and poverty level among single males in the United States with a correlation coefficient (R) of 0.622 and weighted average of 12.4%. Similarly, the statistical analysis conducted on geographies consisting of 200,638,280 people shows a moderate positive correlation between the proportion of Palestinians and poverty level among single males in the United States with a correlation coefficient (R) of 0.426 and weighted average of 12.7%, a difference of 2.9%.
Single Male Poverty Correlation Summary
| Measurement | Kenyan | Palestinian |
| Minimum | 4.8% | 1.9% |
| Maximum | 63.6% | 42.4% |
| Range | 58.9% | 40.5% |
| Mean | 19.3% | 15.3% |
| Median | 14.0% | 12.5% |
| Interquartile 25% (IQ1) | 11.5% | 10.8% |
| Interquartile 75% (IQ3) | 25.8% | 16.7% |
| Interquartile Range (IQR) | 14.3% | 5.9% |
| Standard Deviation (Sample) | 13.5% | 8.7% |
| Standard Deviation (Population) | 13.3% | 8.6% |
Similar Demographics by Single Male Poverty
Demographics Similar to Kenyans by Single Male Poverty
In terms of single male poverty, the demographic groups most similar to Kenyans are Immigrants from North Macedonia (12.3%, a difference of 0.060%), Immigrants from Portugal (12.3%, a difference of 0.070%), Pakistani (12.4%, a difference of 0.19%), Nicaraguan (12.4%, a difference of 0.23%), and Ugandan (12.3%, a difference of 0.30%).
| Demographics | Rating | Rank | Single Male Poverty |
| Jordanians | 95.9 /100 | #105 | Exceptional 12.3% |
| Immigrants | Morocco | 95.6 /100 | #106 | Exceptional 12.3% |
| Iraqis | 95.1 /100 | #107 | Exceptional 12.3% |
| Immigrants | Eastern Africa | 95.0 /100 | #108 | Exceptional 12.3% |
| Ugandans | 94.5 /100 | #109 | Exceptional 12.3% |
| Immigrants | Portugal | 93.6 /100 | #110 | Exceptional 12.3% |
| Immigrants | North Macedonia | 93.6 /100 | #111 | Exceptional 12.3% |
| Kenyans | 93.3 /100 | #112 | Exceptional 12.4% |
| Pakistanis | 92.4 /100 | #113 | Exceptional 12.4% |
| Nicaraguans | 92.1 /100 | #114 | Exceptional 12.4% |
| Immigrants | Southern Europe | 91.5 /100 | #115 | Exceptional 12.4% |
| Immigrants | Syria | 91.2 /100 | #116 | Exceptional 12.4% |
| Immigrants | Oceania | 91.1 /100 | #117 | Exceptional 12.4% |
| Albanians | 90.6 /100 | #118 | Exceptional 12.4% |
| Immigrants | Albania | 90.3 /100 | #119 | Exceptional 12.4% |
Demographics Similar to Palestinians by Single Male Poverty
In terms of single male poverty, the demographic groups most similar to Palestinians are Eastern European (12.7%, a difference of 0.010%), Immigrants from Nigeria (12.7%, a difference of 0.010%), Immigrants from Africa (12.7%, a difference of 0.020%), Immigrants from Cambodia (12.7%, a difference of 0.050%), and Immigrants from Liberia (12.7%, a difference of 0.060%).
| Demographics | Rating | Rank | Single Male Poverty |
| Vietnamese | 67.9 /100 | #156 | Good 12.7% |
| Latvians | 67.9 /100 | #157 | Good 12.7% |
| Immigrants | Middle Africa | 64.9 /100 | #158 | Good 12.7% |
| Immigrants | Liberia | 64.2 /100 | #159 | Good 12.7% |
| Greeks | 64.1 /100 | #160 | Good 12.7% |
| Immigrants | Africa | 63.4 /100 | #161 | Good 12.7% |
| Eastern Europeans | 63.3 /100 | #162 | Good 12.7% |
| Palestinians | 63.1 /100 | #163 | Good 12.7% |
| Immigrants | Nigeria | 62.8 /100 | #164 | Good 12.7% |
| Immigrants | Cambodia | 62.2 /100 | #165 | Good 12.7% |
| Immigrants | Guyana | 60.5 /100 | #166 | Good 12.7% |
| Immigrants | Sudan | 58.2 /100 | #167 | Average 12.7% |
| Immigrants | Barbados | 57.7 /100 | #168 | Average 12.7% |
| Puget Sound Salish | 54.3 /100 | #169 | Average 12.8% |
| Guyanese | 52.0 /100 | #170 | Average 12.8% |