Yugoslavian vs Austrian Single Male Poverty
COMPARE
Yugoslavian
Austrian
Single Male Poverty
Single Male Poverty Comparison
Yugoslavians
Austrians
12.6%
SINGLE MALE POVERTY
73.9/ 100
METRIC RATING
148th/ 347
METRIC RANK
13.1%
SINGLE MALE POVERTY
13.9/ 100
METRIC RATING
216th/ 347
METRIC RANK
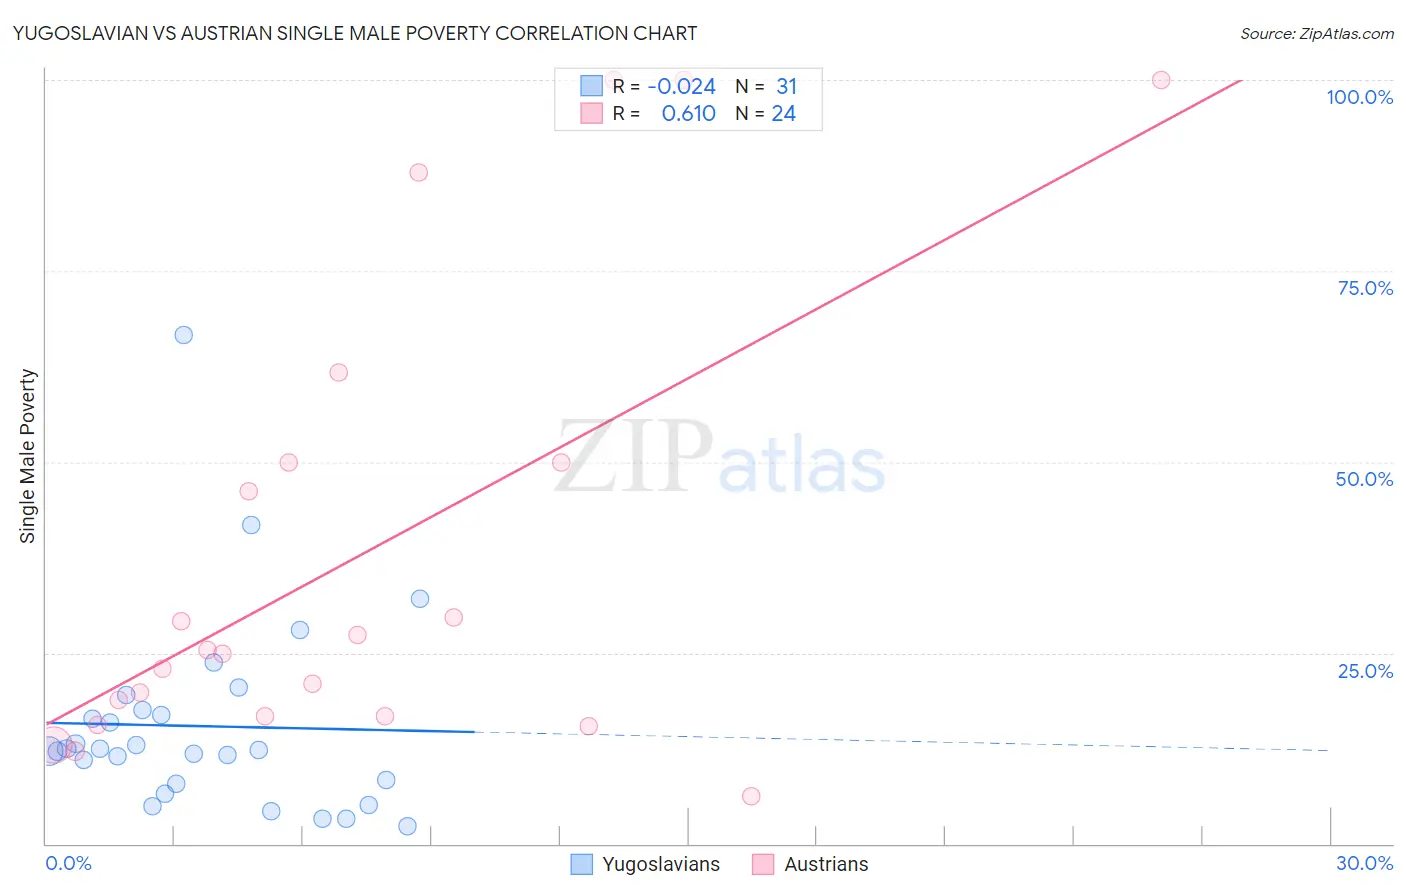
Yugoslavian vs Austrian Single Male Poverty Correlation Chart
The statistical analysis conducted on geographies consisting of 258,600,754 people shows no correlation between the proportion of Yugoslavians and poverty level among single males in the United States with a correlation coefficient (R) of -0.024 and weighted average of 12.6%. Similarly, the statistical analysis conducted on geographies consisting of 387,730,655 people shows a significant positive correlation between the proportion of Austrians and poverty level among single males in the United States with a correlation coefficient (R) of 0.610 and weighted average of 13.1%, a difference of 3.8%.
Single Male Poverty Correlation Summary
| Measurement | Yugoslavian | Austrian |
| Minimum | 2.3% | 6.2% |
| Maximum | 66.7% | 100.0% |
| Range | 64.4% | 93.8% |
| Mean | 15.4% | 37.9% |
| Median | 12.3% | 25.1% |
| Interquartile 25% (IQ1) | 7.9% | 16.7% |
| Interquartile 75% (IQ3) | 17.6% | 50.0% |
| Interquartile Range (IQR) | 9.7% | 33.3% |
| Standard Deviation (Sample) | 12.9% | 30.2% |
| Standard Deviation (Population) | 12.7% | 29.6% |
Similar Demographics by Single Male Poverty
Demographics Similar to Yugoslavians by Single Male Poverty
In terms of single male poverty, the demographic groups most similar to Yugoslavians are Malaysian (12.6%, a difference of 0.060%), Immigrants from Lebanon (12.6%, a difference of 0.070%), Native Hawaiian (12.6%, a difference of 0.070%), Sierra Leonean (12.6%, a difference of 0.070%), and Hawaiian (12.6%, a difference of 0.080%).
| Demographics | Rating | Rank | Single Male Poverty |
| Okinawans | 75.9 /100 | #141 | Good 12.6% |
| Immigrants | Uganda | 75.9 /100 | #142 | Good 12.6% |
| Immigrants | France | 75.8 /100 | #143 | Good 12.6% |
| Hawaiians | 75.1 /100 | #144 | Good 12.6% |
| Immigrants | Lebanon | 75.0 /100 | #145 | Good 12.6% |
| Native Hawaiians | 75.0 /100 | #146 | Good 12.6% |
| Malaysians | 74.8 /100 | #147 | Good 12.6% |
| Yugoslavians | 73.9 /100 | #148 | Good 12.6% |
| Sierra Leoneans | 73.0 /100 | #149 | Good 12.6% |
| Immigrants | Panama | 72.1 /100 | #150 | Good 12.6% |
| Immigrants | Hungary | 71.9 /100 | #151 | Good 12.6% |
| Australians | 71.4 /100 | #152 | Good 12.6% |
| Immigrants | Immigrants | 70.1 /100 | #153 | Good 12.7% |
| Immigrants | Scotland | 68.9 /100 | #154 | Good 12.7% |
| Immigrants | Spain | 68.7 /100 | #155 | Good 12.7% |
Demographics Similar to Austrians by Single Male Poverty
In terms of single male poverty, the demographic groups most similar to Austrians are Japanese (13.1%, a difference of 0.090%), Zimbabwean (13.1%, a difference of 0.10%), Bermudan (13.1%, a difference of 0.10%), Scandinavian (13.1%, a difference of 0.11%), and Immigrants from Burma/Myanmar (13.1%, a difference of 0.15%).
| Demographics | Rating | Rank | Single Male Poverty |
| Mexican American Indians | 17.5 /100 | #209 | Poor 13.1% |
| Immigrants | Haiti | 16.8 /100 | #210 | Poor 13.1% |
| Swedes | 16.8 /100 | #211 | Poor 13.1% |
| Senegalese | 16.4 /100 | #212 | Poor 13.1% |
| Italians | 15.9 /100 | #213 | Poor 13.1% |
| Zimbabweans | 14.9 /100 | #214 | Poor 13.1% |
| Japanese | 14.8 /100 | #215 | Poor 13.1% |
| Austrians | 13.9 /100 | #216 | Poor 13.1% |
| Bermudans | 13.0 /100 | #217 | Poor 13.1% |
| Scandinavians | 12.9 /100 | #218 | Poor 13.1% |
| Immigrants | Burma/Myanmar | 12.6 /100 | #219 | Poor 13.1% |
| Central Americans | 10.9 /100 | #220 | Poor 13.2% |
| New Zealanders | 10.7 /100 | #221 | Poor 13.2% |
| Immigrants | Western Europe | 10.0 /100 | #222 | Poor 13.2% |
| Immigrants | Azores | 9.3 /100 | #223 | Tragic 13.2% |