Yugoslavian vs Marshallese Single Father Poverty
COMPARE
Yugoslavian
Marshallese
Single Father Poverty
Single Father Poverty Comparison
Yugoslavians
Marshallese
16.3%
SINGLE FATHER POVERTY
53.9/ 100
METRIC RATING
167th/ 347
METRIC RANK
16.9%
SINGLE FATHER POVERTY
3.1/ 100
METRIC RATING
234th/ 347
METRIC RANK
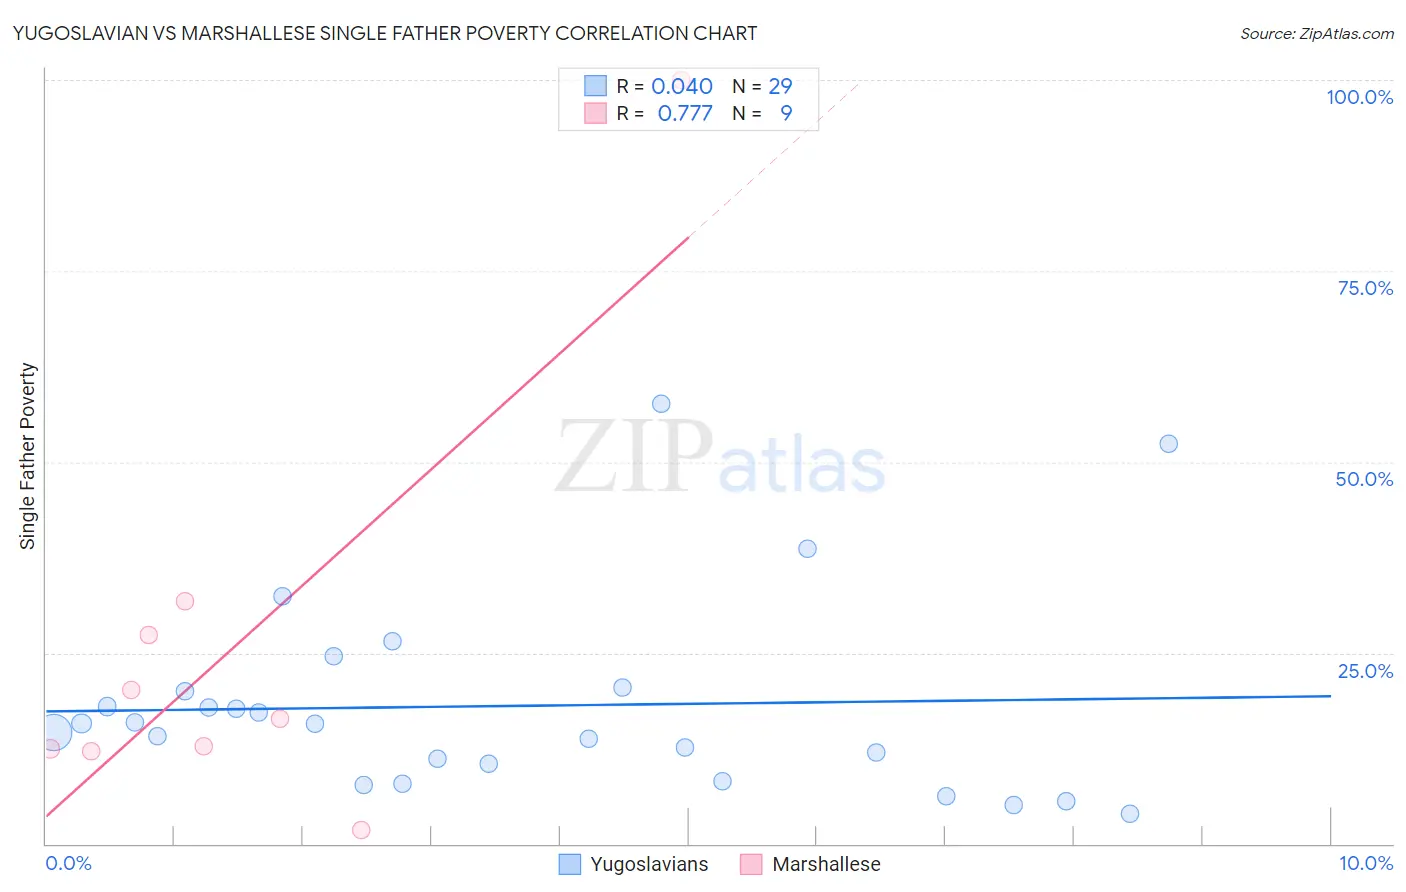
Yugoslavian vs Marshallese Single Father Poverty Correlation Chart
The statistical analysis conducted on geographies consisting of 233,019,111 people shows no correlation between the proportion of Yugoslavians and poverty level among single fathers in the United States with a correlation coefficient (R) of 0.040 and weighted average of 16.3%. Similarly, the statistical analysis conducted on geographies consisting of 13,927,336 people shows a strong positive correlation between the proportion of Marshallese and poverty level among single fathers in the United States with a correlation coefficient (R) of 0.777 and weighted average of 16.9%, a difference of 4.0%.
Single Father Poverty Correlation Summary
| Measurement | Yugoslavian | Marshallese |
| Minimum | 4.0% | 1.9% |
| Maximum | 57.7% | 100.0% |
| Range | 53.7% | 98.1% |
| Mean | 18.0% | 26.1% |
| Median | 15.7% | 16.3% |
| Interquartile 25% (IQ1) | 9.3% | 12.3% |
| Interquartile 75% (IQ3) | 20.2% | 29.5% |
| Interquartile Range (IQR) | 10.9% | 17.2% |
| Standard Deviation (Sample) | 13.0% | 29.1% |
| Standard Deviation (Population) | 12.8% | 27.4% |
Similar Demographics by Single Father Poverty
Demographics Similar to Yugoslavians by Single Father Poverty
In terms of single father poverty, the demographic groups most similar to Yugoslavians are Costa Rican (16.3%, a difference of 0.010%), Immigrants from Europe (16.3%, a difference of 0.040%), Immigrants from Bangladesh (16.3%, a difference of 0.050%), Northern European (16.3%, a difference of 0.050%), and Guyanese (16.3%, a difference of 0.060%).
| Demographics | Rating | Rank | Single Father Poverty |
| Immigrants | Sudan | 59.8 /100 | #160 | Average 16.2% |
| Estonians | 56.7 /100 | #161 | Average 16.2% |
| Ugandans | 55.9 /100 | #162 | Average 16.3% |
| Immigrants | Costa Rica | 55.7 /100 | #163 | Average 16.3% |
| Guyanese | 55.2 /100 | #164 | Average 16.3% |
| Immigrants | Bangladesh | 55.1 /100 | #165 | Average 16.3% |
| Immigrants | Europe | 54.8 /100 | #166 | Average 16.3% |
| Yugoslavians | 53.9 /100 | #167 | Average 16.3% |
| Costa Ricans | 53.6 /100 | #168 | Average 16.3% |
| Northern Europeans | 52.8 /100 | #169 | Average 16.3% |
| Scandinavians | 52.3 /100 | #170 | Average 16.3% |
| Immigrants | Morocco | 50.7 /100 | #171 | Average 16.3% |
| Immigrants | Sierra Leone | 50.1 /100 | #172 | Average 16.3% |
| Immigrants | St. Vincent and the Grenadines | 50.0 /100 | #173 | Average 16.3% |
| Swedes | 50.0 /100 | #174 | Average 16.3% |
Demographics Similar to Marshallese by Single Father Poverty
In terms of single father poverty, the demographic groups most similar to Marshallese are Senegalese (16.9%, a difference of 0.030%), Immigrants from Western Europe (16.9%, a difference of 0.10%), Immigrants from Germany (16.9%, a difference of 0.10%), Subsaharan African (16.9%, a difference of 0.10%), and Immigrants from Grenada (16.9%, a difference of 0.17%).
| Demographics | Rating | Rank | Single Father Poverty |
| British | 5.6 /100 | #227 | Tragic 16.8% |
| Belgians | 5.3 /100 | #228 | Tragic 16.8% |
| Israelis | 4.6 /100 | #229 | Tragic 16.8% |
| Immigrants | Trinidad and Tobago | 4.5 /100 | #230 | Tragic 16.8% |
| Spanish Americans | 3.7 /100 | #231 | Tragic 16.9% |
| Immigrants | Grenada | 3.7 /100 | #232 | Tragic 16.9% |
| Senegalese | 3.2 /100 | #233 | Tragic 16.9% |
| Marshallese | 3.1 /100 | #234 | Tragic 16.9% |
| Immigrants | Western Europe | 2.9 /100 | #235 | Tragic 16.9% |
| Immigrants | Germany | 2.9 /100 | #236 | Tragic 16.9% |
| Sub-Saharan Africans | 2.9 /100 | #237 | Tragic 16.9% |
| Immigrants | Saudi Arabia | 2.7 /100 | #238 | Tragic 16.9% |
| Bermudans | 2.6 /100 | #239 | Tragic 16.9% |
| Finns | 2.6 /100 | #240 | Tragic 16.9% |
| Czechs | 2.3 /100 | #241 | Tragic 17.0% |