Immigrants from Ghana vs Marshallese Single Father Poverty
COMPARE
Immigrants from Ghana
Marshallese
Single Father Poverty
Single Father Poverty Comparison
Immigrants from Ghana
Marshallese
16.7%
SINGLE FATHER POVERTY
8.1/ 100
METRIC RATING
219th/ 347
METRIC RANK
16.9%
SINGLE FATHER POVERTY
3.1/ 100
METRIC RATING
234th/ 347
METRIC RANK
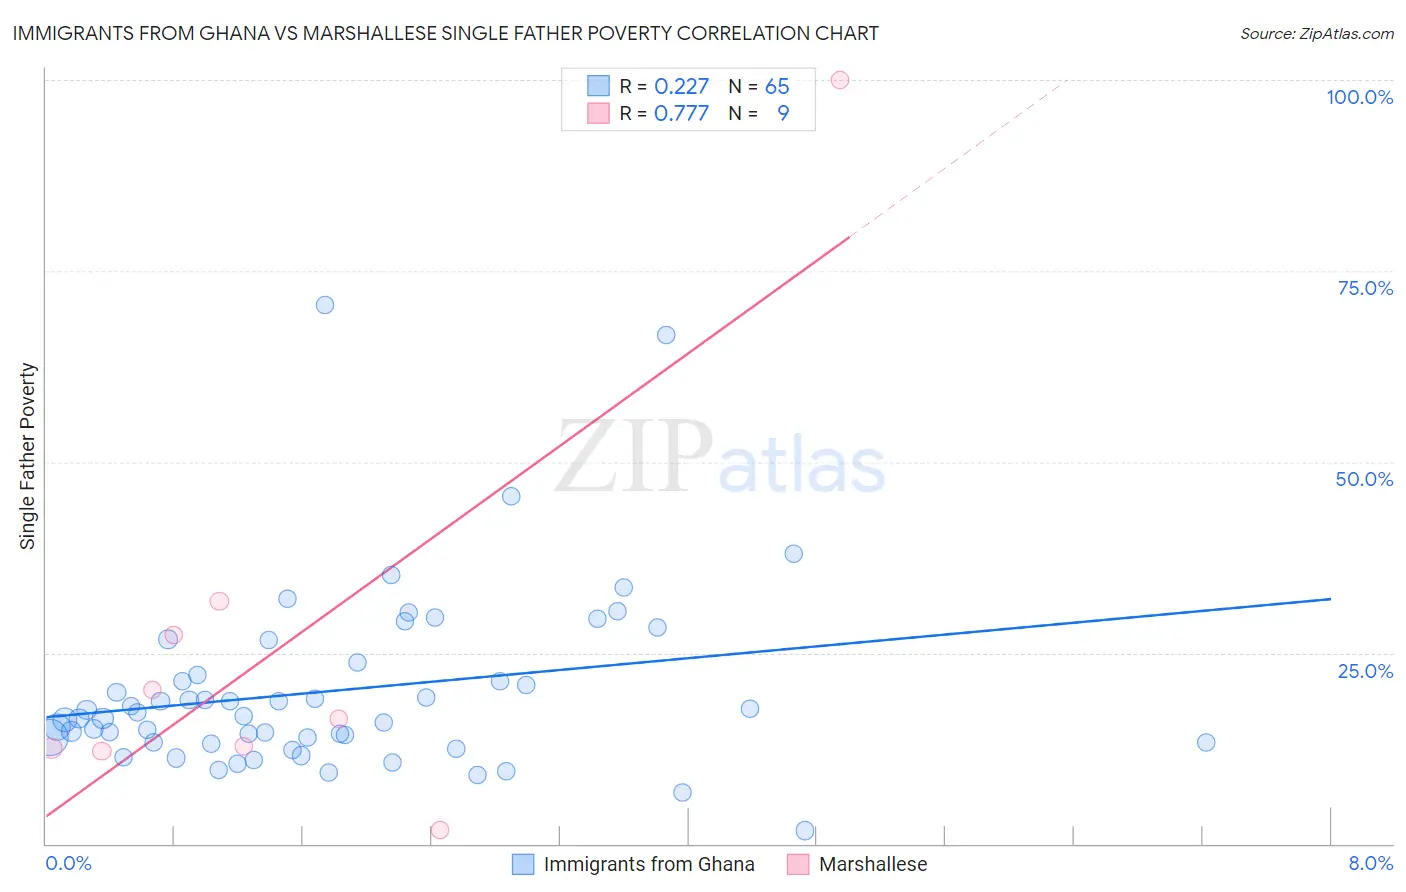
Immigrants from Ghana vs Marshallese Single Father Poverty Correlation Chart
The statistical analysis conducted on geographies consisting of 172,701,802 people shows a weak positive correlation between the proportion of Immigrants from Ghana and poverty level among single fathers in the United States with a correlation coefficient (R) of 0.227 and weighted average of 16.7%. Similarly, the statistical analysis conducted on geographies consisting of 13,927,336 people shows a strong positive correlation between the proportion of Marshallese and poverty level among single fathers in the United States with a correlation coefficient (R) of 0.777 and weighted average of 16.9%, a difference of 1.1%.
Single Father Poverty Correlation Summary
| Measurement | Immigrants from Ghana | Marshallese |
| Minimum | 1.7% | 1.9% |
| Maximum | 70.6% | 100.0% |
| Range | 68.9% | 98.1% |
| Mean | 20.0% | 26.1% |
| Median | 16.8% | 16.3% |
| Interquartile 25% (IQ1) | 13.3% | 12.3% |
| Interquartile 75% (IQ3) | 22.9% | 29.5% |
| Interquartile Range (IQR) | 9.6% | 17.2% |
| Standard Deviation (Sample) | 11.9% | 29.1% |
| Standard Deviation (Population) | 11.8% | 27.4% |
Demographics Similar to Immigrants from Ghana and Marshallese by Single Father Poverty
In terms of single father poverty, the demographic groups most similar to Immigrants from Ghana are Immigrants from Denmark (16.7%, a difference of 0.010%), Immigrants from Greece (16.7%, a difference of 0.010%), Immigrants from Spain (16.7%, a difference of 0.020%), Immigrants from Uganda (16.7%, a difference of 0.060%), and Cheyenne (16.7%, a difference of 0.16%). Similarly, the demographic groups most similar to Marshallese are Senegalese (16.9%, a difference of 0.030%), Immigrants from Western Europe (16.9%, a difference of 0.10%), Immigrants from Germany (16.9%, a difference of 0.10%), Immigrants from Grenada (16.9%, a difference of 0.17%), and Spanish American (16.9%, a difference of 0.19%).
| Demographics | Rating | Rank | Single Father Poverty |
| Immigrants | England | 9.5 /100 | #216 | Tragic 16.7% |
| Cheyenne | 9.3 /100 | #217 | Tragic 16.7% |
| Immigrants | Uganda | 8.6 /100 | #218 | Tragic 16.7% |
| Immigrants | Ghana | 8.1 /100 | #219 | Tragic 16.7% |
| Immigrants | Denmark | 8.1 /100 | #220 | Tragic 16.7% |
| Immigrants | Greece | 8.1 /100 | #221 | Tragic 16.7% |
| Immigrants | Spain | 8.0 /100 | #222 | Tragic 16.7% |
| Immigrants | Austria | 7.0 /100 | #223 | Tragic 16.8% |
| Immigrants | Norway | 6.5 /100 | #224 | Tragic 16.8% |
| Menominee | 6.4 /100 | #225 | Tragic 16.8% |
| Hispanics or Latinos | 6.1 /100 | #226 | Tragic 16.8% |
| British | 5.6 /100 | #227 | Tragic 16.8% |
| Belgians | 5.3 /100 | #228 | Tragic 16.8% |
| Israelis | 4.6 /100 | #229 | Tragic 16.8% |
| Immigrants | Trinidad and Tobago | 4.5 /100 | #230 | Tragic 16.8% |
| Spanish Americans | 3.7 /100 | #231 | Tragic 16.9% |
| Immigrants | Grenada | 3.7 /100 | #232 | Tragic 16.9% |
| Senegalese | 3.2 /100 | #233 | Tragic 16.9% |
| Marshallese | 3.1 /100 | #234 | Tragic 16.9% |
| Immigrants | Western Europe | 2.9 /100 | #235 | Tragic 16.9% |
| Immigrants | Germany | 2.9 /100 | #236 | Tragic 16.9% |