Bulgarian vs Marshallese Single Father Poverty
COMPARE
Bulgarian
Marshallese
Single Father Poverty
Single Father Poverty Comparison
Bulgarians
Marshallese
15.8%
SINGLE FATHER POVERTY
94.8/ 100
METRIC RATING
111th/ 347
METRIC RANK
16.9%
SINGLE FATHER POVERTY
3.1/ 100
METRIC RATING
234th/ 347
METRIC RANK
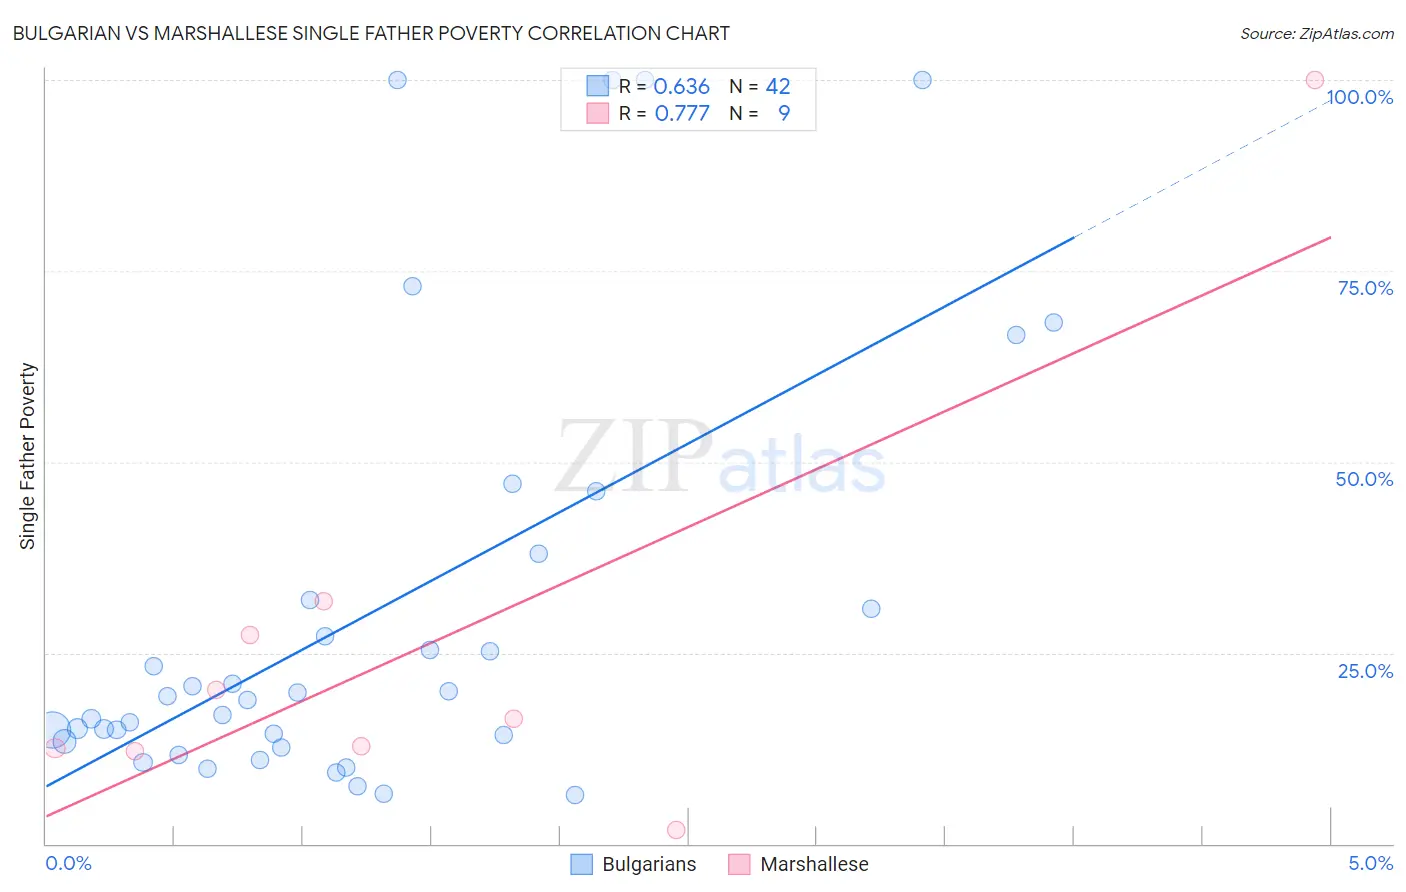
Bulgarian vs Marshallese Single Father Poverty Correlation Chart
The statistical analysis conducted on geographies consisting of 171,442,330 people shows a significant positive correlation between the proportion of Bulgarians and poverty level among single fathers in the United States with a correlation coefficient (R) of 0.636 and weighted average of 15.8%. Similarly, the statistical analysis conducted on geographies consisting of 13,927,336 people shows a strong positive correlation between the proportion of Marshallese and poverty level among single fathers in the United States with a correlation coefficient (R) of 0.777 and weighted average of 16.9%, a difference of 7.2%.
Single Father Poverty Correlation Summary
| Measurement | Bulgarian | Marshallese |
| Minimum | 6.3% | 1.9% |
| Maximum | 100.0% | 100.0% |
| Range | 93.7% | 98.1% |
| Mean | 30.2% | 26.1% |
| Median | 19.1% | 16.3% |
| Interquartile 25% (IQ1) | 13.4% | 12.3% |
| Interquartile 75% (IQ3) | 32.0% | 29.5% |
| Interquartile Range (IQR) | 18.5% | 17.2% |
| Standard Deviation (Sample) | 27.9% | 29.1% |
| Standard Deviation (Population) | 27.6% | 27.4% |
Similar Demographics by Single Father Poverty
Demographics Similar to Bulgarians by Single Father Poverty
In terms of single father poverty, the demographic groups most similar to Bulgarians are Immigrants from Latvia (15.8%, a difference of 0.030%), Immigrants from Africa (15.8%, a difference of 0.050%), Turkish (15.8%, a difference of 0.060%), Danish (15.8%, a difference of 0.080%), and Argentinean (15.8%, a difference of 0.090%).
| Demographics | Rating | Rank | Single Father Poverty |
| Australians | 96.1 /100 | #104 | Exceptional 15.7% |
| Immigrants | Australia | 96.1 /100 | #105 | Exceptional 15.7% |
| Immigrants | Poland | 95.8 /100 | #106 | Exceptional 15.7% |
| Native Hawaiians | 95.8 /100 | #107 | Exceptional 15.7% |
| Pakistanis | 95.7 /100 | #108 | Exceptional 15.7% |
| Turks | 95.1 /100 | #109 | Exceptional 15.8% |
| Immigrants | Africa | 95.1 /100 | #110 | Exceptional 15.8% |
| Bulgarians | 94.8 /100 | #111 | Exceptional 15.8% |
| Immigrants | Latvia | 94.7 /100 | #112 | Exceptional 15.8% |
| Danes | 94.5 /100 | #113 | Exceptional 15.8% |
| Argentineans | 94.4 /100 | #114 | Exceptional 15.8% |
| Immigrants | Thailand | 93.6 /100 | #115 | Exceptional 15.8% |
| Immigrants | Argentina | 92.8 /100 | #116 | Exceptional 15.8% |
| Immigrants | Colombia | 92.6 /100 | #117 | Exceptional 15.8% |
| Immigrants | Eastern Europe | 92.5 /100 | #118 | Exceptional 15.8% |
Demographics Similar to Marshallese by Single Father Poverty
In terms of single father poverty, the demographic groups most similar to Marshallese are Senegalese (16.9%, a difference of 0.030%), Immigrants from Western Europe (16.9%, a difference of 0.10%), Immigrants from Germany (16.9%, a difference of 0.10%), Subsaharan African (16.9%, a difference of 0.10%), and Immigrants from Grenada (16.9%, a difference of 0.17%).
| Demographics | Rating | Rank | Single Father Poverty |
| British | 5.6 /100 | #227 | Tragic 16.8% |
| Belgians | 5.3 /100 | #228 | Tragic 16.8% |
| Israelis | 4.6 /100 | #229 | Tragic 16.8% |
| Immigrants | Trinidad and Tobago | 4.5 /100 | #230 | Tragic 16.8% |
| Spanish Americans | 3.7 /100 | #231 | Tragic 16.9% |
| Immigrants | Grenada | 3.7 /100 | #232 | Tragic 16.9% |
| Senegalese | 3.2 /100 | #233 | Tragic 16.9% |
| Marshallese | 3.1 /100 | #234 | Tragic 16.9% |
| Immigrants | Western Europe | 2.9 /100 | #235 | Tragic 16.9% |
| Immigrants | Germany | 2.9 /100 | #236 | Tragic 16.9% |
| Sub-Saharan Africans | 2.9 /100 | #237 | Tragic 16.9% |
| Immigrants | Saudi Arabia | 2.7 /100 | #238 | Tragic 16.9% |
| Bermudans | 2.6 /100 | #239 | Tragic 16.9% |
| Finns | 2.6 /100 | #240 | Tragic 16.9% |
| Czechs | 2.3 /100 | #241 | Tragic 17.0% |