Yugoslavian vs Nicaraguan Single Father Poverty
COMPARE
Yugoslavian
Nicaraguan
Single Father Poverty
Single Father Poverty Comparison
Yugoslavians
Nicaraguans
16.3%
SINGLE FATHER POVERTY
53.9/ 100
METRIC RATING
167th/ 347
METRIC RANK
15.9%
SINGLE FATHER POVERTY
90.1/ 100
METRIC RATING
131st/ 347
METRIC RANK
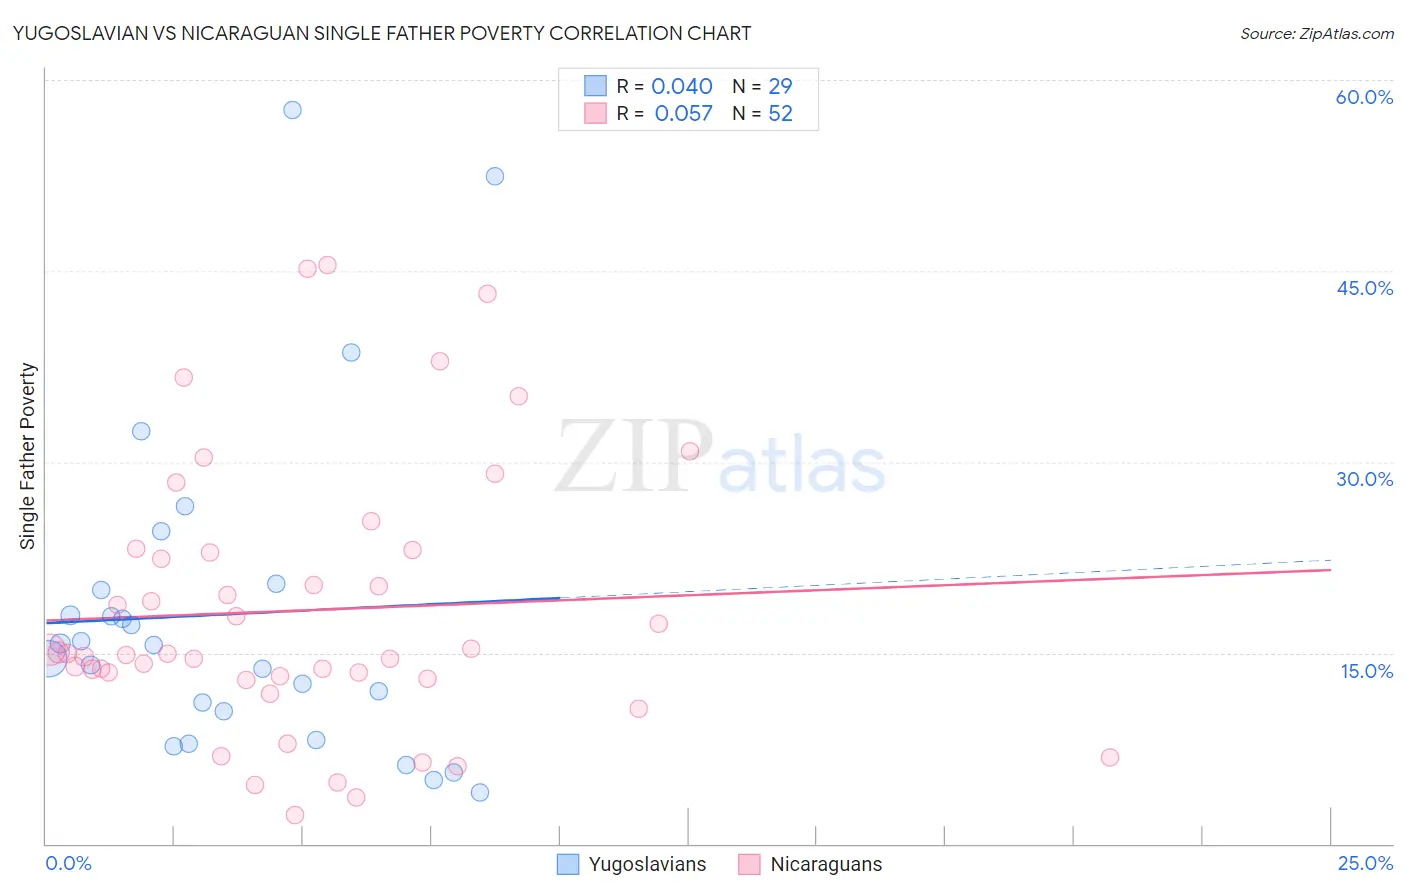
Yugoslavian vs Nicaraguan Single Father Poverty Correlation Chart
The statistical analysis conducted on geographies consisting of 233,019,111 people shows no correlation between the proportion of Yugoslavians and poverty level among single fathers in the United States with a correlation coefficient (R) of 0.040 and weighted average of 16.3%. Similarly, the statistical analysis conducted on geographies consisting of 241,925,601 people shows a slight positive correlation between the proportion of Nicaraguans and poverty level among single fathers in the United States with a correlation coefficient (R) of 0.057 and weighted average of 15.9%, a difference of 2.3%.
Single Father Poverty Correlation Summary
| Measurement | Yugoslavian | Nicaraguan |
| Minimum | 4.0% | 2.2% |
| Maximum | 57.7% | 45.5% |
| Range | 53.7% | 43.2% |
| Mean | 18.0% | 18.3% |
| Median | 15.7% | 15.0% |
| Interquartile 25% (IQ1) | 9.3% | 13.1% |
| Interquartile 75% (IQ3) | 20.2% | 23.0% |
| Interquartile Range (IQR) | 10.9% | 9.9% |
| Standard Deviation (Sample) | 13.0% | 10.6% |
| Standard Deviation (Population) | 12.8% | 10.5% |
Similar Demographics by Single Father Poverty
Demographics Similar to Yugoslavians by Single Father Poverty
In terms of single father poverty, the demographic groups most similar to Yugoslavians are Costa Rican (16.3%, a difference of 0.010%), Immigrants from Europe (16.3%, a difference of 0.040%), Immigrants from Bangladesh (16.3%, a difference of 0.050%), Northern European (16.3%, a difference of 0.050%), and Guyanese (16.3%, a difference of 0.060%).
| Demographics | Rating | Rank | Single Father Poverty |
| Immigrants | Sudan | 59.8 /100 | #160 | Average 16.2% |
| Estonians | 56.7 /100 | #161 | Average 16.2% |
| Ugandans | 55.9 /100 | #162 | Average 16.3% |
| Immigrants | Costa Rica | 55.7 /100 | #163 | Average 16.3% |
| Guyanese | 55.2 /100 | #164 | Average 16.3% |
| Immigrants | Bangladesh | 55.1 /100 | #165 | Average 16.3% |
| Immigrants | Europe | 54.8 /100 | #166 | Average 16.3% |
| Yugoslavians | 53.9 /100 | #167 | Average 16.3% |
| Costa Ricans | 53.6 /100 | #168 | Average 16.3% |
| Northern Europeans | 52.8 /100 | #169 | Average 16.3% |
| Scandinavians | 52.3 /100 | #170 | Average 16.3% |
| Immigrants | Morocco | 50.7 /100 | #171 | Average 16.3% |
| Immigrants | Sierra Leone | 50.1 /100 | #172 | Average 16.3% |
| Immigrants | St. Vincent and the Grenadines | 50.0 /100 | #173 | Average 16.3% |
| Swedes | 50.0 /100 | #174 | Average 16.3% |
Demographics Similar to Nicaraguans by Single Father Poverty
In terms of single father poverty, the demographic groups most similar to Nicaraguans are Norwegian (15.9%, a difference of 0.0%), Immigrants from Portugal (15.9%, a difference of 0.060%), Immigrants from Syria (15.9%, a difference of 0.070%), Immigrants from West Indies (15.9%, a difference of 0.080%), and Immigrants from Nigeria (15.9%, a difference of 0.090%).
| Demographics | Rating | Rank | Single Father Poverty |
| Immigrants | Panama | 91.3 /100 | #124 | Exceptional 15.9% |
| Iraqis | 91.2 /100 | #125 | Exceptional 15.9% |
| Hmong | 91.1 /100 | #126 | Exceptional 15.9% |
| Immigrants | Liberia | 91.1 /100 | #127 | Exceptional 15.9% |
| Immigrants | Nigeria | 90.8 /100 | #128 | Exceptional 15.9% |
| Immigrants | West Indies | 90.8 /100 | #129 | Exceptional 15.9% |
| Norwegians | 90.2 /100 | #130 | Exceptional 15.9% |
| Nicaraguans | 90.1 /100 | #131 | Exceptional 15.9% |
| Immigrants | Portugal | 89.7 /100 | #132 | Excellent 15.9% |
| Immigrants | Syria | 89.5 /100 | #133 | Excellent 15.9% |
| Immigrants | South America | 88.5 /100 | #134 | Excellent 15.9% |
| Immigrants | Sri Lanka | 88.2 /100 | #135 | Excellent 15.9% |
| Cypriots | 87.5 /100 | #136 | Excellent 15.9% |
| Immigrants | Azores | 87.2 /100 | #137 | Excellent 15.9% |
| Central Americans | 87.1 /100 | #138 | Excellent 16.0% |