Yugoslavian vs Immigrants from Taiwan Receiving Food Stamps
COMPARE
Yugoslavian
Immigrants from Taiwan
Receiving Food Stamps
Receiving Food Stamps Comparison
Yugoslavians
Immigrants from Taiwan
10.7%
RECEIVING FOOD STAMPS
92.5/ 100
METRIC RATING
129th/ 347
METRIC RANK
7.3%
RECEIVING FOOD STAMPS
100.0/ 100
METRIC RATING
1st/ 347
METRIC RANK
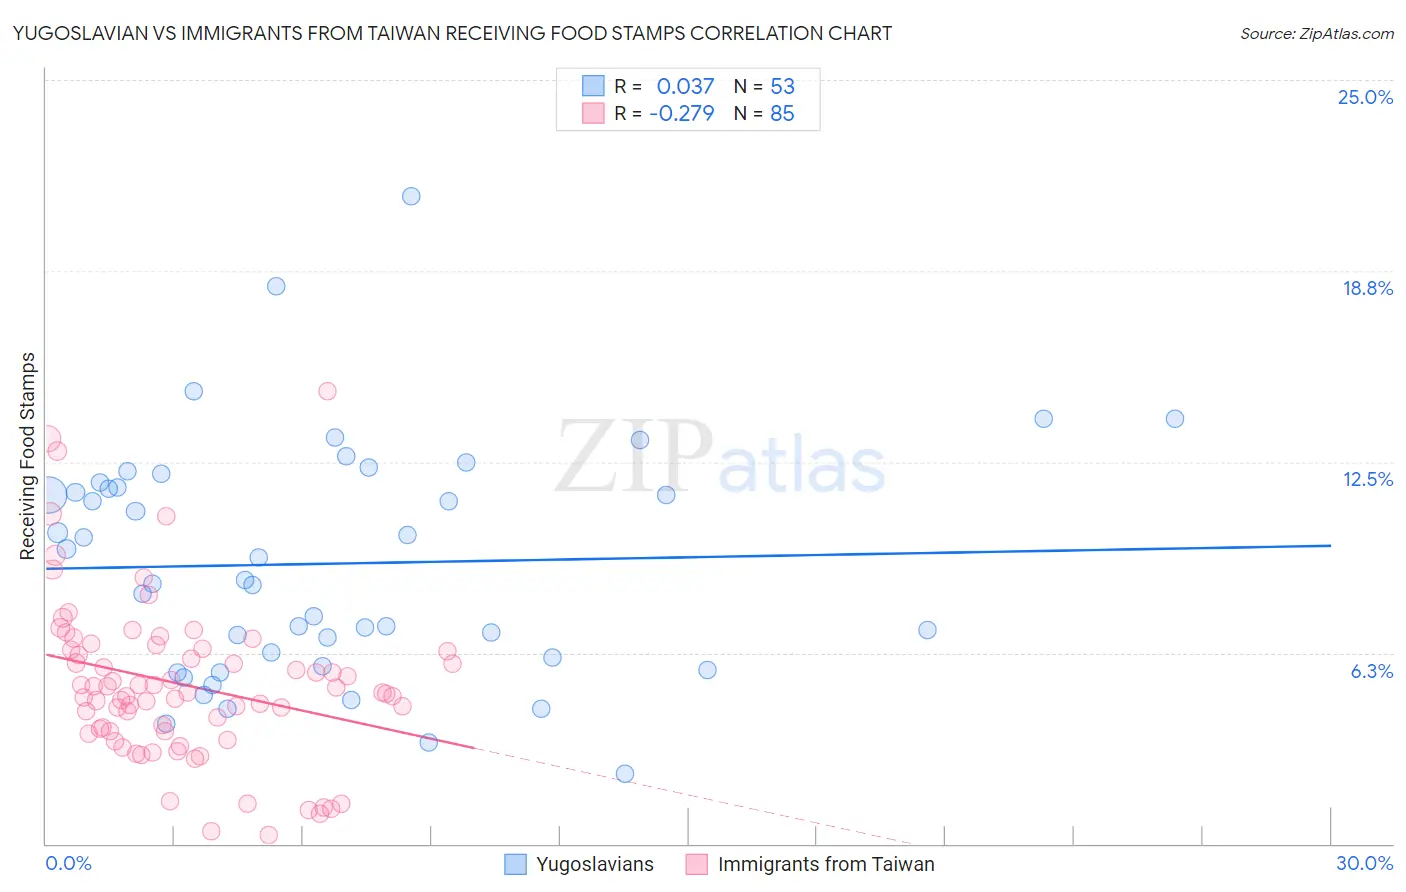
Yugoslavian vs Immigrants from Taiwan Receiving Food Stamps Correlation Chart
The statistical analysis conducted on geographies consisting of 285,227,567 people shows no correlation between the proportion of Yugoslavians and percentage of population receiving government assistance and/or food stamps in the United States with a correlation coefficient (R) of 0.037 and weighted average of 10.7%. Similarly, the statistical analysis conducted on geographies consisting of 297,390,748 people shows a weak negative correlation between the proportion of Immigrants from Taiwan and percentage of population receiving government assistance and/or food stamps in the United States with a correlation coefficient (R) of -0.279 and weighted average of 7.3%, a difference of 46.4%.
Receiving Food Stamps Correlation Summary
| Measurement | Yugoslavian | Immigrants from Taiwan |
| Minimum | 2.3% | 0.30% |
| Maximum | 21.2% | 14.8% |
| Range | 18.9% | 14.5% |
| Mean | 9.2% | 5.2% |
| Median | 8.6% | 4.9% |
| Interquartile 25% (IQ1) | 5.9% | 3.7% |
| Interquartile 75% (IQ3) | 11.7% | 6.4% |
| Interquartile Range (IQR) | 5.8% | 2.7% |
| Standard Deviation (Sample) | 3.8% | 2.7% |
| Standard Deviation (Population) | 3.8% | 2.7% |
Similar Demographics by Receiving Food Stamps
Demographics Similar to Yugoslavians by Receiving Food Stamps
In terms of receiving food stamps, the demographic groups most similar to Yugoslavians are Immigrants from Jordan (10.7%, a difference of 0.0%), Immigrants from Ethiopia (10.7%, a difference of 0.010%), Afghan (10.7%, a difference of 0.030%), Israeli (10.7%, a difference of 0.10%), and French (10.7%, a difference of 0.10%).
| Demographics | Rating | Rank | Receiving Food Stamps |
| Sri Lankans | 93.7 /100 | #122 | Exceptional 10.6% |
| Immigrants | Philippines | 93.3 /100 | #123 | Exceptional 10.7% |
| Paraguayans | 93.0 /100 | #124 | Exceptional 10.7% |
| Ukrainians | 92.8 /100 | #125 | Exceptional 10.7% |
| Afghans | 92.6 /100 | #126 | Exceptional 10.7% |
| Immigrants | Ethiopia | 92.6 /100 | #127 | Exceptional 10.7% |
| Immigrants | Jordan | 92.5 /100 | #128 | Exceptional 10.7% |
| Yugoslavians | 92.5 /100 | #129 | Exceptional 10.7% |
| Israelis | 92.4 /100 | #130 | Exceptional 10.7% |
| French | 92.3 /100 | #131 | Exceptional 10.7% |
| Immigrants | Germany | 92.0 /100 | #132 | Exceptional 10.7% |
| Immigrants | Russia | 90.9 /100 | #133 | Exceptional 10.8% |
| Immigrants | Brazil | 90.3 /100 | #134 | Exceptional 10.8% |
| Argentineans | 90.2 /100 | #135 | Exceptional 10.8% |
| Slovaks | 89.8 /100 | #136 | Excellent 10.8% |
Demographics Similar to Immigrants from Taiwan by Receiving Food Stamps
In terms of receiving food stamps, the demographic groups most similar to Immigrants from Taiwan are Immigrants from India (7.4%, a difference of 0.87%), Filipino (7.4%, a difference of 1.1%), Iranian (7.9%, a difference of 8.5%), Thai (8.1%, a difference of 11.0%), and Immigrants from Singapore (8.3%, a difference of 13.6%).
| Demographics | Rating | Rank | Receiving Food Stamps |
| Immigrants | Taiwan | 100.0 /100 | #1 | Exceptional 7.3% |
| Immigrants | India | 100.0 /100 | #2 | Exceptional 7.4% |
| Filipinos | 100.0 /100 | #3 | Exceptional 7.4% |
| Iranians | 100.0 /100 | #4 | Exceptional 7.9% |
| Thais | 100.0 /100 | #5 | Exceptional 8.1% |
| Immigrants | Singapore | 100.0 /100 | #6 | Exceptional 8.3% |
| Immigrants | Iran | 100.0 /100 | #7 | Exceptional 8.3% |
| Burmese | 99.9 /100 | #8 | Exceptional 8.6% |
| Immigrants | Korea | 99.9 /100 | #9 | Exceptional 8.7% |
| Immigrants | South Central Asia | 99.9 /100 | #10 | Exceptional 8.8% |
| Okinawans | 99.9 /100 | #11 | Exceptional 8.9% |
| Cypriots | 99.9 /100 | #12 | Exceptional 8.9% |
| Bulgarians | 99.9 /100 | #13 | Exceptional 8.9% |
| Maltese | 99.9 /100 | #14 | Exceptional 8.9% |
| Norwegians | 99.9 /100 | #15 | Exceptional 9.0% |