Yugoslavian vs Hispanic or Latino Child Poverty Among Girls Under 16
COMPARE
Yugoslavian
Hispanic or Latino
Child Poverty Among Girls Under 16
Child Poverty Among Girls Under 16 Comparison
Yugoslavians
Hispanics or Latinos
16.2%
CHILD POVERTY AMONG GIRLS UNDER 16
64.4/ 100
METRIC RATING
168th/ 347
METRIC RANK
21.0%
CHILD POVERTY AMONG GIRLS UNDER 16
0.0/ 100
METRIC RATING
299th/ 347
METRIC RANK
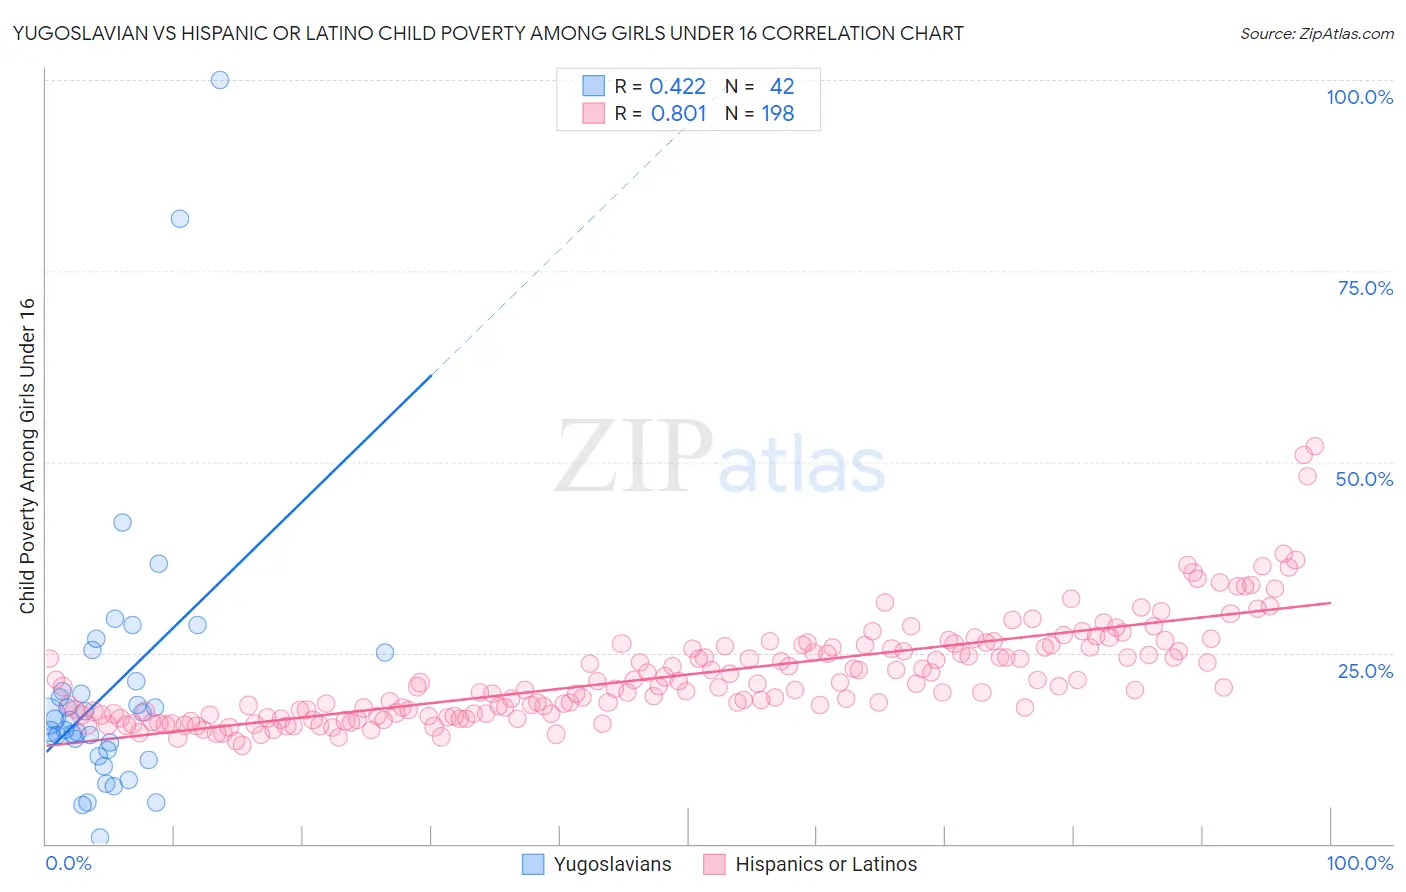
Yugoslavian vs Hispanic or Latino Child Poverty Among Girls Under 16 Correlation Chart
The statistical analysis conducted on geographies consisting of 281,961,993 people shows a moderate positive correlation between the proportion of Yugoslavians and poverty level among girls under the age of 16 in the United States with a correlation coefficient (R) of 0.422 and weighted average of 16.2%. Similarly, the statistical analysis conducted on geographies consisting of 552,365,780 people shows a very strong positive correlation between the proportion of Hispanics or Latinos and poverty level among girls under the age of 16 in the United States with a correlation coefficient (R) of 0.801 and weighted average of 21.0%, a difference of 29.4%.
Child Poverty Among Girls Under 16 Correlation Summary
| Measurement | Yugoslavian | Hispanic or Latino |
| Minimum | 0.83% | 12.9% |
| Maximum | 100.0% | 52.1% |
| Range | 99.2% | 39.2% |
| Mean | 20.4% | 22.1% |
| Median | 16.2% | 20.5% |
| Interquartile 25% (IQ1) | 12.3% | 16.9% |
| Interquartile 75% (IQ3) | 21.3% | 25.7% |
| Interquartile Range (IQR) | 9.1% | 8.8% |
| Standard Deviation (Sample) | 18.1% | 6.7% |
| Standard Deviation (Population) | 17.9% | 6.7% |
Similar Demographics by Child Poverty Among Girls Under 16
Demographics Similar to Yugoslavians by Child Poverty Among Girls Under 16
In terms of child poverty among girls under 16, the demographic groups most similar to Yugoslavians are Costa Rican (16.2%, a difference of 0.010%), Immigrants from Venezuela (16.2%, a difference of 0.020%), Uruguayan (16.2%, a difference of 0.040%), Immigrants from Saudi Arabia (16.2%, a difference of 0.050%), and Afghan (16.2%, a difference of 0.26%).
| Demographics | Rating | Rank | Child Poverty Among Girls Under 16 |
| Immigrants | Northern Africa | 72.0 /100 | #161 | Good 16.0% |
| French Canadians | 68.7 /100 | #162 | Good 16.1% |
| Immigrants | Oceania | 68.4 /100 | #163 | Good 16.1% |
| Immigrants | Colombia | 67.8 /100 | #164 | Good 16.1% |
| Immigrants | Germany | 67.3 /100 | #165 | Good 16.1% |
| South Americans | 67.2 /100 | #166 | Good 16.1% |
| Uruguayans | 64.7 /100 | #167 | Good 16.2% |
| Yugoslavians | 64.4 /100 | #168 | Good 16.2% |
| Costa Ricans | 64.2 /100 | #169 | Good 16.2% |
| Immigrants | Venezuela | 64.2 /100 | #170 | Good 16.2% |
| Immigrants | Saudi Arabia | 64.0 /100 | #171 | Good 16.2% |
| Afghans | 62.3 /100 | #172 | Good 16.2% |
| Immigrants | South America | 55.1 /100 | #173 | Average 16.4% |
| Ethiopians | 50.0 /100 | #174 | Average 16.5% |
| Lebanese | 45.4 /100 | #175 | Average 16.6% |
Demographics Similar to Hispanics or Latinos by Child Poverty Among Girls Under 16
In terms of child poverty among girls under 16, the demographic groups most similar to Hispanics or Latinos are Somali (21.0%, a difference of 0.31%), Mexican (20.9%, a difference of 0.40%), Inupiat (20.8%, a difference of 0.93%), Choctaw (21.1%, a difference of 0.93%), and Immigrants from West Indies (20.7%, a difference of 1.0%).
| Demographics | Rating | Rank | Child Poverty Among Girls Under 16 |
| Immigrants | Latin America | 0.0 /100 | #292 | Tragic 20.6% |
| Immigrants | Grenada | 0.0 /100 | #293 | Tragic 20.7% |
| Immigrants | Senegal | 0.0 /100 | #294 | Tragic 20.7% |
| Immigrants | Caribbean | 0.0 /100 | #295 | Tragic 20.7% |
| Immigrants | West Indies | 0.0 /100 | #296 | Tragic 20.7% |
| Inupiat | 0.0 /100 | #297 | Tragic 20.8% |
| Mexicans | 0.0 /100 | #298 | Tragic 20.9% |
| Hispanics or Latinos | 0.0 /100 | #299 | Tragic 21.0% |
| Somalis | 0.0 /100 | #300 | Tragic 21.0% |
| Choctaw | 0.0 /100 | #301 | Tragic 21.1% |
| Seminole | 0.0 /100 | #302 | Tragic 21.2% |
| British West Indians | 0.0 /100 | #303 | Tragic 21.3% |
| Indonesians | 0.0 /100 | #304 | Tragic 21.3% |
| Guatemalans | 0.0 /100 | #305 | Tragic 21.4% |
| Immigrants | Central America | 0.0 /100 | #306 | Tragic 21.4% |