Immigrants from Lebanon vs Immigrants from South Central Asia Male Poverty
COMPARE
Immigrants from Lebanon
Immigrants from South Central Asia
Male Poverty
Male Poverty Comparison
Immigrants from Lebanon
Immigrants from South Central Asia
11.7%
MALE POVERTY
13.6/ 100
METRIC RATING
200th/ 347
METRIC RANK
9.3%
MALE POVERTY
99.9/ 100
METRIC RATING
9th/ 347
METRIC RANK
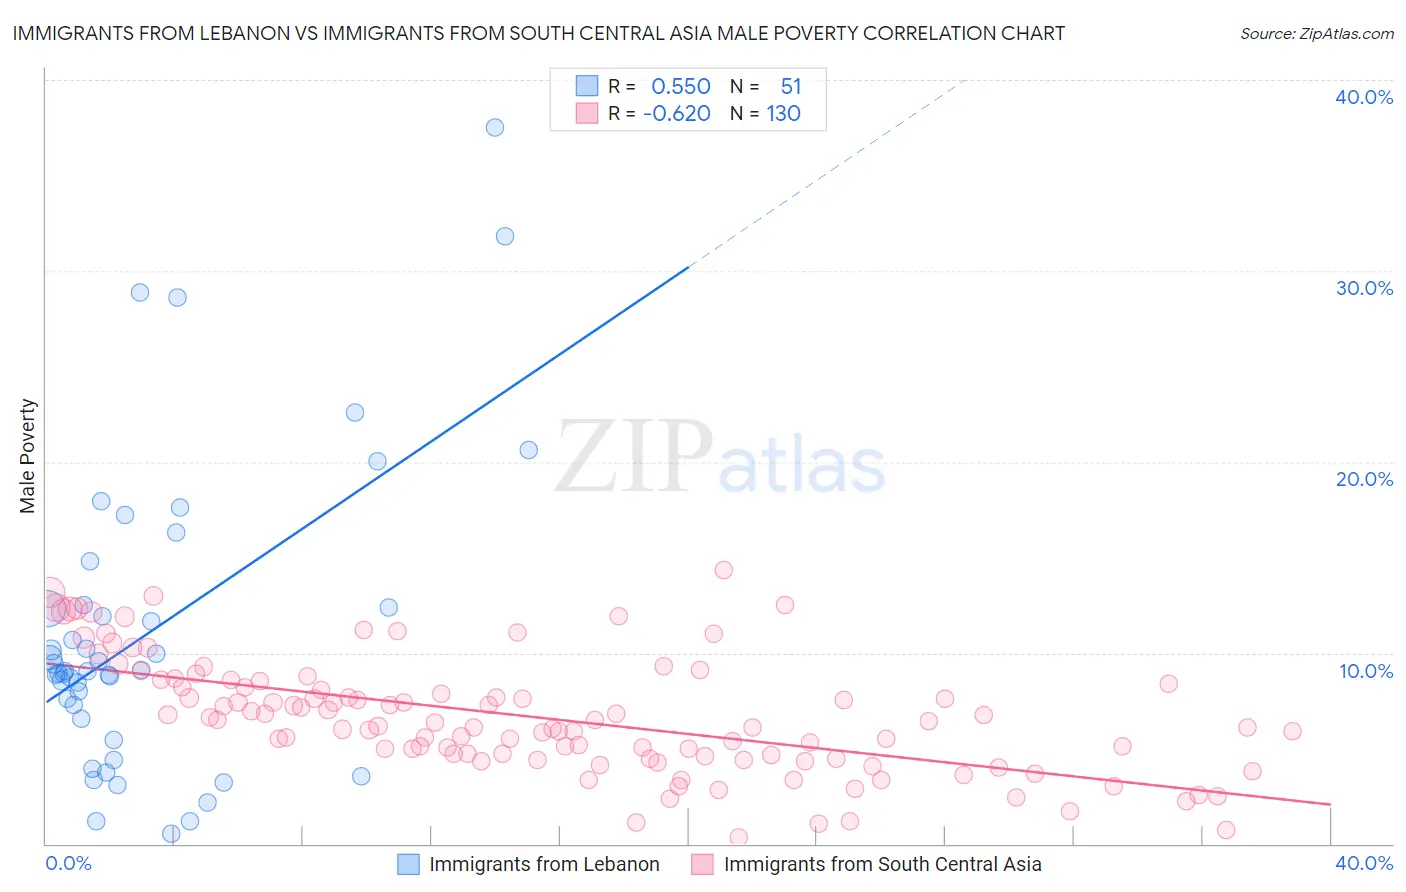
Immigrants from Lebanon vs Immigrants from South Central Asia Male Poverty Correlation Chart
The statistical analysis conducted on geographies consisting of 217,104,675 people shows a substantial positive correlation between the proportion of Immigrants from Lebanon and poverty level among males in the United States with a correlation coefficient (R) of 0.550 and weighted average of 11.7%. Similarly, the statistical analysis conducted on geographies consisting of 472,354,703 people shows a significant negative correlation between the proportion of Immigrants from South Central Asia and poverty level among males in the United States with a correlation coefficient (R) of -0.620 and weighted average of 9.3%, a difference of 26.1%.
Male Poverty Correlation Summary
| Measurement | Immigrants from Lebanon | Immigrants from South Central Asia |
| Minimum | 0.52% | 0.33% |
| Maximum | 37.5% | 14.4% |
| Range | 37.0% | 14.0% |
| Mean | 11.1% | 6.6% |
| Median | 9.1% | 6.2% |
| Interquartile 25% (IQ1) | 6.6% | 4.6% |
| Interquartile 75% (IQ3) | 12.5% | 8.4% |
| Interquartile Range (IQR) | 5.9% | 3.8% |
| Standard Deviation (Sample) | 8.0% | 3.0% |
| Standard Deviation (Population) | 7.9% | 3.0% |
Similar Demographics by Male Poverty
Demographics Similar to Immigrants from Lebanon by Male Poverty
In terms of male poverty, the demographic groups most similar to Immigrants from Lebanon are Spaniard (11.7%, a difference of 0.010%), Spanish (11.7%, a difference of 0.10%), Iraqi (11.7%, a difference of 0.21%), Delaware (11.7%, a difference of 0.35%), and Hmong (11.6%, a difference of 0.41%).
| Demographics | Rating | Rank | Male Poverty |
| Immigrants | Kuwait | 17.3 /100 | #193 | Poor 11.6% |
| Immigrants | Kenya | 16.1 /100 | #194 | Poor 11.6% |
| Arabs | 15.8 /100 | #195 | Poor 11.6% |
| Hmong | 15.8 /100 | #196 | Poor 11.6% |
| Delaware | 15.4 /100 | #197 | Poor 11.7% |
| Iraqis | 14.7 /100 | #198 | Poor 11.7% |
| Spanish | 14.1 /100 | #199 | Poor 11.7% |
| Immigrants | Lebanon | 13.6 /100 | #200 | Poor 11.7% |
| Spaniards | 13.5 /100 | #201 | Poor 11.7% |
| Aleuts | 10.4 /100 | #202 | Poor 11.8% |
| Immigrants | Western Asia | 9.8 /100 | #203 | Tragic 11.8% |
| Immigrants | Uganda | 8.5 /100 | #204 | Tragic 11.8% |
| Panamanians | 6.2 /100 | #205 | Tragic 11.9% |
| Immigrants | Eastern Africa | 5.4 /100 | #206 | Tragic 12.0% |
| Malaysians | 5.2 /100 | #207 | Tragic 12.0% |
Demographics Similar to Immigrants from South Central Asia by Male Poverty
In terms of male poverty, the demographic groups most similar to Immigrants from South Central Asia are Bulgarian (9.3%, a difference of 0.56%), Filipino (9.2%, a difference of 0.79%), Bolivian (9.4%, a difference of 1.2%), Immigrants from Bolivia (9.4%, a difference of 1.3%), and Immigrants from Lithuania (9.4%, a difference of 1.4%).
| Demographics | Rating | Rank | Male Poverty |
| Chinese | 100.0 /100 | #2 | Exceptional 8.7% |
| Thais | 100.0 /100 | #3 | Exceptional 8.7% |
| Immigrants | Taiwan | 100.0 /100 | #4 | Exceptional 8.9% |
| Maltese | 100.0 /100 | #5 | Exceptional 9.1% |
| Assyrians/Chaldeans/Syriacs | 99.9 /100 | #6 | Exceptional 9.1% |
| Immigrants | Ireland | 99.9 /100 | #7 | Exceptional 9.1% |
| Filipinos | 99.9 /100 | #8 | Exceptional 9.2% |
| Immigrants | South Central Asia | 99.9 /100 | #9 | Exceptional 9.3% |
| Bulgarians | 99.9 /100 | #10 | Exceptional 9.3% |
| Bolivians | 99.9 /100 | #11 | Exceptional 9.4% |
| Immigrants | Bolivia | 99.9 /100 | #12 | Exceptional 9.4% |
| Immigrants | Lithuania | 99.9 /100 | #13 | Exceptional 9.4% |
| Immigrants | North Macedonia | 99.8 /100 | #14 | Exceptional 9.4% |
| Bhutanese | 99.8 /100 | #15 | Exceptional 9.5% |
| Luxembourgers | 99.8 /100 | #16 | Exceptional 9.5% |