Yakama vs New Zealander Child Poverty Among Boys Under 16
COMPARE
Yakama
New Zealander
Child Poverty Among Boys Under 16
Child Poverty Among Boys Under 16 Comparison
Yakama
New Zealanders
21.7%
CHILD POVERTY AMONG BOYS UNDER 16
0.0/ 100
METRIC RATING
318th/ 347
METRIC RANK
15.7%
CHILD POVERTY AMONG BOYS UNDER 16
82.4/ 100
METRIC RATING
146th/ 347
METRIC RANK
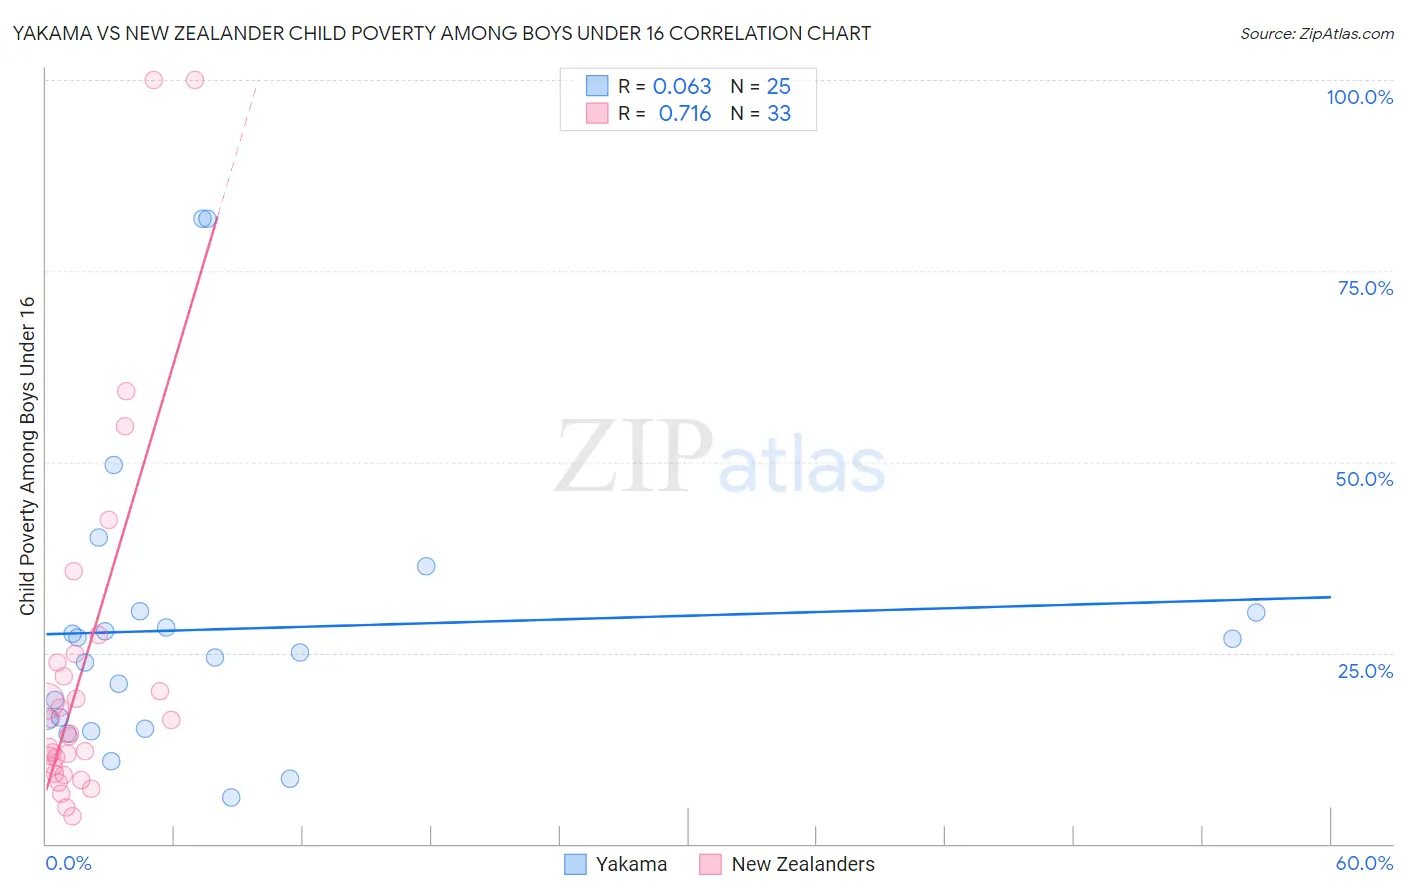
Yakama vs New Zealander Child Poverty Among Boys Under 16 Correlation Chart
The statistical analysis conducted on geographies consisting of 19,821,804 people shows a slight positive correlation between the proportion of Yakama and poverty level among boys under the age of 16 in the United States with a correlation coefficient (R) of 0.063 and weighted average of 21.7%. Similarly, the statistical analysis conducted on geographies consisting of 106,111,867 people shows a strong positive correlation between the proportion of New Zealanders and poverty level among boys under the age of 16 in the United States with a correlation coefficient (R) of 0.716 and weighted average of 15.7%, a difference of 38.3%.
Child Poverty Among Boys Under 16 Correlation Summary
| Measurement | Yakama | New Zealander |
| Minimum | 6.1% | 3.6% |
| Maximum | 81.8% | 100.0% |
| Range | 75.8% | 96.4% |
| Mean | 28.1% | 23.2% |
| Median | 25.0% | 14.4% |
| Interquartile 25% (IQ1) | 15.7% | 9.7% |
| Interquartile 75% (IQ3) | 30.4% | 24.3% |
| Interquartile Range (IQR) | 14.7% | 14.6% |
| Standard Deviation (Sample) | 18.9% | 23.7% |
| Standard Deviation (Population) | 18.6% | 23.4% |
Similar Demographics by Child Poverty Among Boys Under 16
Demographics Similar to Yakama by Child Poverty Among Boys Under 16
In terms of child poverty among boys under 16, the demographic groups most similar to Yakama are African (21.7%, a difference of 0.060%), Immigrants from Somalia (21.7%, a difference of 0.14%), Menominee (21.7%, a difference of 0.14%), Dutch West Indian (21.8%, a difference of 0.48%), and Ute (21.6%, a difference of 0.74%).
| Demographics | Rating | Rank | Child Poverty Among Boys Under 16 |
| Bahamians | 0.0 /100 | #311 | Tragic 21.6% |
| Immigrants | Guatemala | 0.0 /100 | #312 | Tragic 21.6% |
| British West Indians | 0.0 /100 | #313 | Tragic 21.6% |
| Ute | 0.0 /100 | #314 | Tragic 21.6% |
| Immigrants | Somalia | 0.0 /100 | #315 | Tragic 21.7% |
| Menominee | 0.0 /100 | #316 | Tragic 21.7% |
| Africans | 0.0 /100 | #317 | Tragic 21.7% |
| Yakama | 0.0 /100 | #318 | Tragic 21.7% |
| Dutch West Indians | 0.0 /100 | #319 | Tragic 21.8% |
| U.S. Virgin Islanders | 0.0 /100 | #320 | Tragic 22.0% |
| Cajuns | 0.0 /100 | #321 | Tragic 22.2% |
| Immigrants | Dominica | 0.0 /100 | #322 | Tragic 22.2% |
| Hondurans | 0.0 /100 | #323 | Tragic 22.3% |
| Immigrants | Congo | 0.0 /100 | #324 | Tragic 22.4% |
| Central American Indians | 0.0 /100 | #325 | Tragic 22.5% |
Demographics Similar to New Zealanders by Child Poverty Among Boys Under 16
In terms of child poverty among boys under 16, the demographic groups most similar to New Zealanders are Venezuelan (15.7%, a difference of 0.070%), Samoan (15.7%, a difference of 0.16%), Immigrants from Peru (15.7%, a difference of 0.21%), Immigrants from Fiji (15.7%, a difference of 0.24%), and Brazilian (15.8%, a difference of 0.27%).
| Demographics | Rating | Rank | Child Poverty Among Boys Under 16 |
| Albanians | 86.5 /100 | #139 | Excellent 15.6% |
| Immigrants | Kuwait | 85.6 /100 | #140 | Excellent 15.6% |
| Slavs | 84.5 /100 | #141 | Excellent 15.7% |
| Immigrants | Hungary | 84.1 /100 | #142 | Excellent 15.7% |
| Immigrants | Fiji | 83.6 /100 | #143 | Excellent 15.7% |
| Immigrants | Peru | 83.5 /100 | #144 | Excellent 15.7% |
| Samoans | 83.2 /100 | #145 | Excellent 15.7% |
| New Zealanders | 82.4 /100 | #146 | Excellent 15.7% |
| Venezuelans | 82.1 /100 | #147 | Excellent 15.7% |
| Brazilians | 81.0 /100 | #148 | Excellent 15.8% |
| Slovaks | 80.3 /100 | #149 | Excellent 15.8% |
| Immigrants | Jordan | 80.2 /100 | #150 | Excellent 15.8% |
| Puget Sound Salish | 79.8 /100 | #151 | Good 15.8% |
| Immigrants | Venezuela | 79.5 /100 | #152 | Good 15.8% |
| French | 78.7 /100 | #153 | Good 15.8% |