Yakama vs Czech Child Poverty Under the Age of 16
COMPARE
Yakama
Czech
Child Poverty Under the Age of 16
Child Poverty Under the Age of 16 Comparison
Yakama
Czechs
22.1%
CHILD POVERTY UNDER THE AGE OF 16
0.0/ 100
METRIC RATING
319th/ 347
METRIC RANK
13.8%
CHILD POVERTY UNDER THE AGE OF 16
99.3/ 100
METRIC RATING
45th/ 347
METRIC RANK
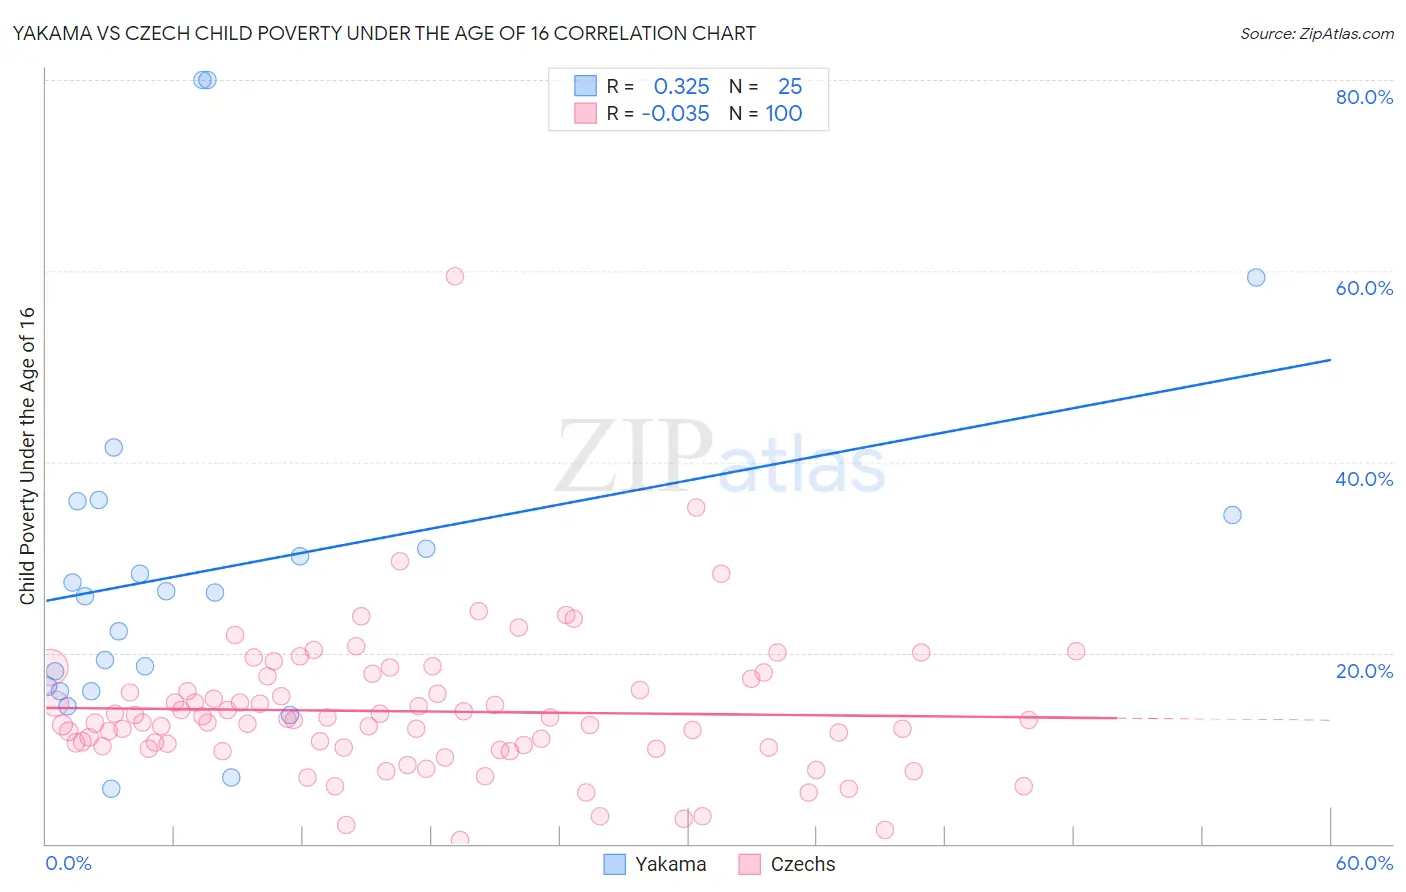
Yakama vs Czech Child Poverty Under the Age of 16 Correlation Chart
The statistical analysis conducted on geographies consisting of 19,893,282 people shows a mild positive correlation between the proportion of Yakama and poverty level among children under the age of 16 in the United States with a correlation coefficient (R) of 0.325 and weighted average of 22.1%. Similarly, the statistical analysis conducted on geographies consisting of 477,035,895 people shows no correlation between the proportion of Czechs and poverty level among children under the age of 16 in the United States with a correlation coefficient (R) of -0.035 and weighted average of 13.8%, a difference of 59.9%.
Child Poverty Under the Age of 16 Correlation Summary
| Measurement | Yakama | Czech |
| Minimum | 5.7% | 0.42% |
| Maximum | 80.0% | 59.4% |
| Range | 74.3% | 59.0% |
| Mean | 29.2% | 13.9% |
| Median | 26.3% | 12.8% |
| Interquartile 25% (IQ1) | 16.3% | 10.1% |
| Interquartile 75% (IQ3) | 35.2% | 16.7% |
| Interquartile Range (IQR) | 18.9% | 6.7% |
| Standard Deviation (Sample) | 19.1% | 7.6% |
| Standard Deviation (Population) | 18.7% | 7.6% |
Similar Demographics by Child Poverty Under the Age of 16
Demographics Similar to Yakama by Child Poverty Under the Age of 16
In terms of child poverty under the age of 16, the demographic groups most similar to Yakama are Cajun (22.1%, a difference of 0.20%), Kiowa (22.2%, a difference of 0.39%), U.S. Virgin Islander (22.0%, a difference of 0.51%), Honduran (22.2%, a difference of 0.58%), and Immigrants from Dominica (21.9%, a difference of 0.91%).
| Demographics | Rating | Rank | Child Poverty Under the Age of 16 |
| Ute | 0.0 /100 | #312 | Tragic 21.5% |
| Creek | 0.0 /100 | #313 | Tragic 21.5% |
| Immigrants | Somalia | 0.0 /100 | #314 | Tragic 21.6% |
| Immigrants | Guatemala | 0.0 /100 | #315 | Tragic 21.6% |
| Africans | 0.0 /100 | #316 | Tragic 21.7% |
| Immigrants | Dominica | 0.0 /100 | #317 | Tragic 21.9% |
| U.S. Virgin Islanders | 0.0 /100 | #318 | Tragic 22.0% |
| Yakama | 0.0 /100 | #319 | Tragic 22.1% |
| Cajuns | 0.0 /100 | #320 | Tragic 22.1% |
| Kiowa | 0.0 /100 | #321 | Tragic 22.2% |
| Hondurans | 0.0 /100 | #322 | Tragic 22.2% |
| Paiute | 0.0 /100 | #323 | Tragic 22.4% |
| Central American Indians | 0.0 /100 | #324 | Tragic 22.5% |
| Immigrants | Congo | 0.0 /100 | #325 | Tragic 22.5% |
| Immigrants | Honduras | 0.0 /100 | #326 | Tragic 22.7% |
Demographics Similar to Czechs by Child Poverty Under the Age of 16
In terms of child poverty under the age of 16, the demographic groups most similar to Czechs are Greek (13.8%, a difference of 0.050%), Immigrants from Moldova (13.8%, a difference of 0.22%), Immigrants from Sri Lanka (13.8%, a difference of 0.29%), Immigrants from Asia (13.8%, a difference of 0.29%), and Croatian (13.8%, a difference of 0.37%).
| Demographics | Rating | Rank | Child Poverty Under the Age of 16 |
| Luxembourgers | 99.5 /100 | #38 | Exceptional 13.6% |
| Immigrants | Australia | 99.5 /100 | #39 | Exceptional 13.6% |
| Immigrants | Scotland | 99.4 /100 | #40 | Exceptional 13.7% |
| Croatians | 99.4 /100 | #41 | Exceptional 13.8% |
| Immigrants | Sri Lanka | 99.3 /100 | #42 | Exceptional 13.8% |
| Immigrants | Moldova | 99.3 /100 | #43 | Exceptional 13.8% |
| Greeks | 99.3 /100 | #44 | Exceptional 13.8% |
| Czechs | 99.3 /100 | #45 | Exceptional 13.8% |
| Immigrants | Asia | 99.2 /100 | #46 | Exceptional 13.8% |
| Estonians | 99.2 /100 | #47 | Exceptional 13.9% |
| Koreans | 99.2 /100 | #48 | Exceptional 13.9% |
| Italians | 99.2 /100 | #49 | Exceptional 13.9% |
| Immigrants | Czechoslovakia | 99.1 /100 | #50 | Exceptional 13.9% |
| Immigrants | Greece | 99.1 /100 | #51 | Exceptional 13.9% |
| Poles | 98.9 /100 | #52 | Exceptional 14.0% |