Immigrants from Romania vs Czech Child Poverty Under the Age of 16
COMPARE
Immigrants from Romania
Czech
Child Poverty Under the Age of 16
Child Poverty Under the Age of 16 Comparison
Immigrants from Romania
Czechs
14.2%
CHILD POVERTY UNDER THE AGE OF 16
98.3/ 100
METRIC RATING
64th/ 347
METRIC RANK
13.8%
CHILD POVERTY UNDER THE AGE OF 16
99.3/ 100
METRIC RATING
45th/ 347
METRIC RANK
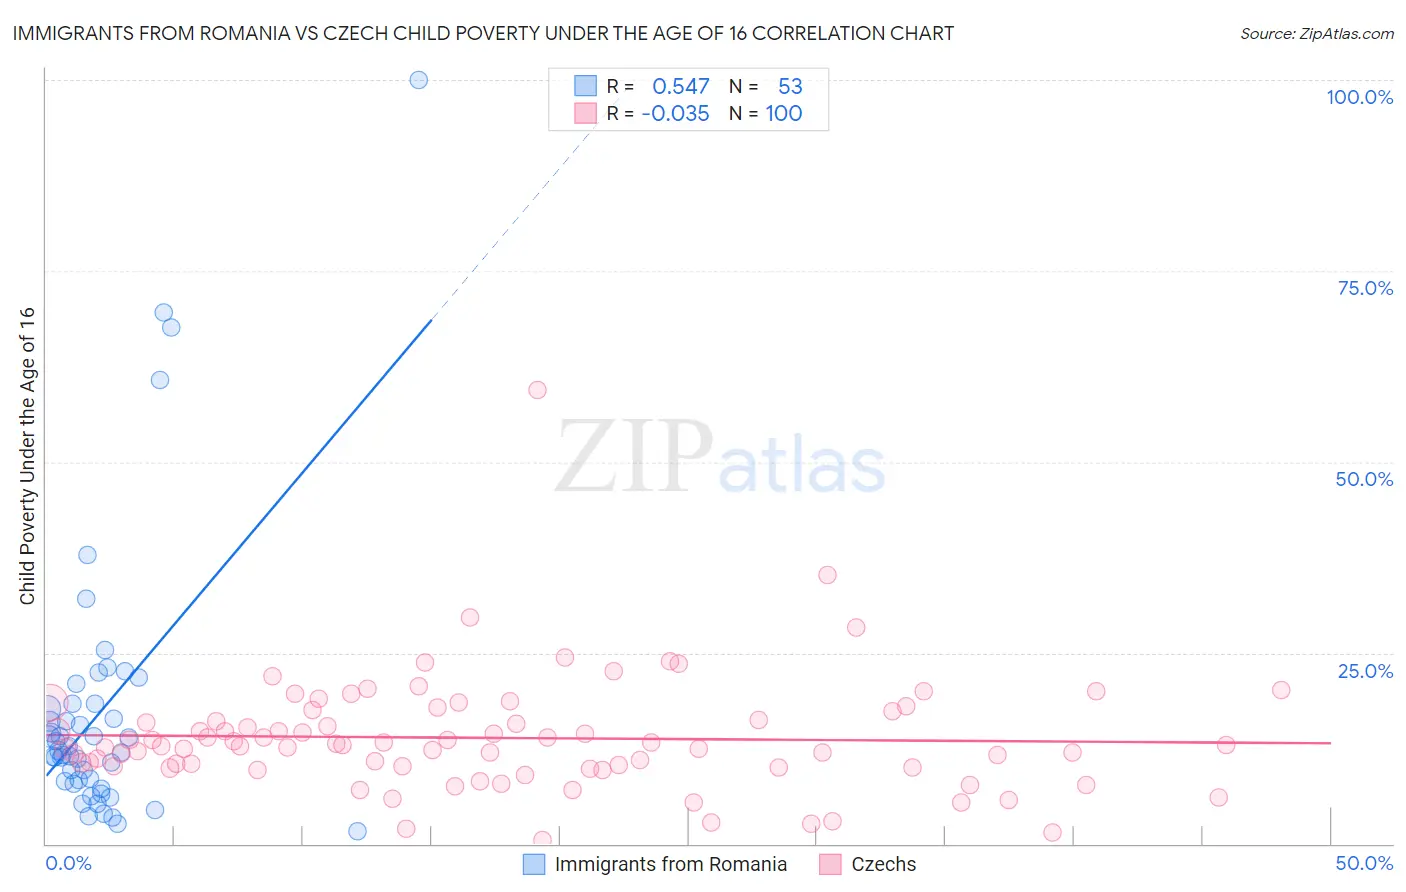
Immigrants from Romania vs Czech Child Poverty Under the Age of 16 Correlation Chart
The statistical analysis conducted on geographies consisting of 255,520,974 people shows a substantial positive correlation between the proportion of Immigrants from Romania and poverty level among children under the age of 16 in the United States with a correlation coefficient (R) of 0.547 and weighted average of 14.2%. Similarly, the statistical analysis conducted on geographies consisting of 477,035,895 people shows no correlation between the proportion of Czechs and poverty level among children under the age of 16 in the United States with a correlation coefficient (R) of -0.035 and weighted average of 13.8%, a difference of 3.1%.
Child Poverty Under the Age of 16 Correlation Summary
| Measurement | Immigrants from Romania | Czech |
| Minimum | 1.6% | 0.42% |
| Maximum | 100.0% | 59.4% |
| Range | 98.4% | 59.0% |
| Mean | 17.6% | 13.9% |
| Median | 12.2% | 12.8% |
| Interquartile 25% (IQ1) | 8.0% | 10.1% |
| Interquartile 75% (IQ3) | 18.3% | 16.7% |
| Interquartile Range (IQR) | 10.3% | 6.7% |
| Standard Deviation (Sample) | 18.4% | 7.6% |
| Standard Deviation (Population) | 18.2% | 7.6% |
Demographics Similar to Immigrants from Romania and Czechs by Child Poverty Under the Age of 16
In terms of child poverty under the age of 16, the demographic groups most similar to Immigrants from Romania are Immigrants from Europe (14.2%, a difference of 0.13%), Zimbabwean (14.2%, a difference of 0.44%), Immigrants from Sweden (14.2%, a difference of 0.45%), Immigrants from Austria (14.2%, a difference of 0.49%), and Scandinavian (14.1%, a difference of 0.68%). Similarly, the demographic groups most similar to Czechs are Greek (13.8%, a difference of 0.050%), Immigrants from Asia (13.8%, a difference of 0.29%), Estonian (13.9%, a difference of 0.45%), Korean (13.9%, a difference of 0.51%), and Italian (13.9%, a difference of 0.54%).
| Demographics | Rating | Rank | Child Poverty Under the Age of 16 |
| Greeks | 99.3 /100 | #44 | Exceptional 13.8% |
| Czechs | 99.3 /100 | #45 | Exceptional 13.8% |
| Immigrants | Asia | 99.2 /100 | #46 | Exceptional 13.8% |
| Estonians | 99.2 /100 | #47 | Exceptional 13.9% |
| Koreans | 99.2 /100 | #48 | Exceptional 13.9% |
| Italians | 99.2 /100 | #49 | Exceptional 13.9% |
| Immigrants | Czechoslovakia | 99.1 /100 | #50 | Exceptional 13.9% |
| Immigrants | Greece | 99.1 /100 | #51 | Exceptional 13.9% |
| Poles | 98.9 /100 | #52 | Exceptional 14.0% |
| Immigrants | Israel | 98.8 /100 | #53 | Exceptional 14.1% |
| Tsimshian | 98.8 /100 | #54 | Exceptional 14.1% |
| Immigrants | Indonesia | 98.7 /100 | #55 | Exceptional 14.1% |
| Immigrants | Serbia | 98.7 /100 | #56 | Exceptional 14.1% |
| Immigrants | Belgium | 98.6 /100 | #57 | Exceptional 14.1% |
| Immigrants | Pakistan | 98.6 /100 | #58 | Exceptional 14.1% |
| Scandinavians | 98.6 /100 | #59 | Exceptional 14.1% |
| Immigrants | Austria | 98.5 /100 | #60 | Exceptional 14.2% |
| Immigrants | Sweden | 98.5 /100 | #61 | Exceptional 14.2% |
| Zimbabweans | 98.5 /100 | #62 | Exceptional 14.2% |
| Immigrants | Europe | 98.4 /100 | #63 | Exceptional 14.2% |
| Immigrants | Romania | 98.3 /100 | #64 | Exceptional 14.2% |