Yakama vs Czech In Labor Force | Age 20-24
COMPARE
Yakama
Czech
In Labor Force | Age 20-24
In Labor Force | Age 20-24 Comparison
Yakama
Czechs
75.1%
IN LABOR FORCE | AGE 20-24
50.8/ 100
METRIC RATING
172nd/ 347
METRIC RANK
78.5%
IN LABOR FORCE | AGE 20-24
100.0/ 100
METRIC RATING
14th/ 347
METRIC RANK
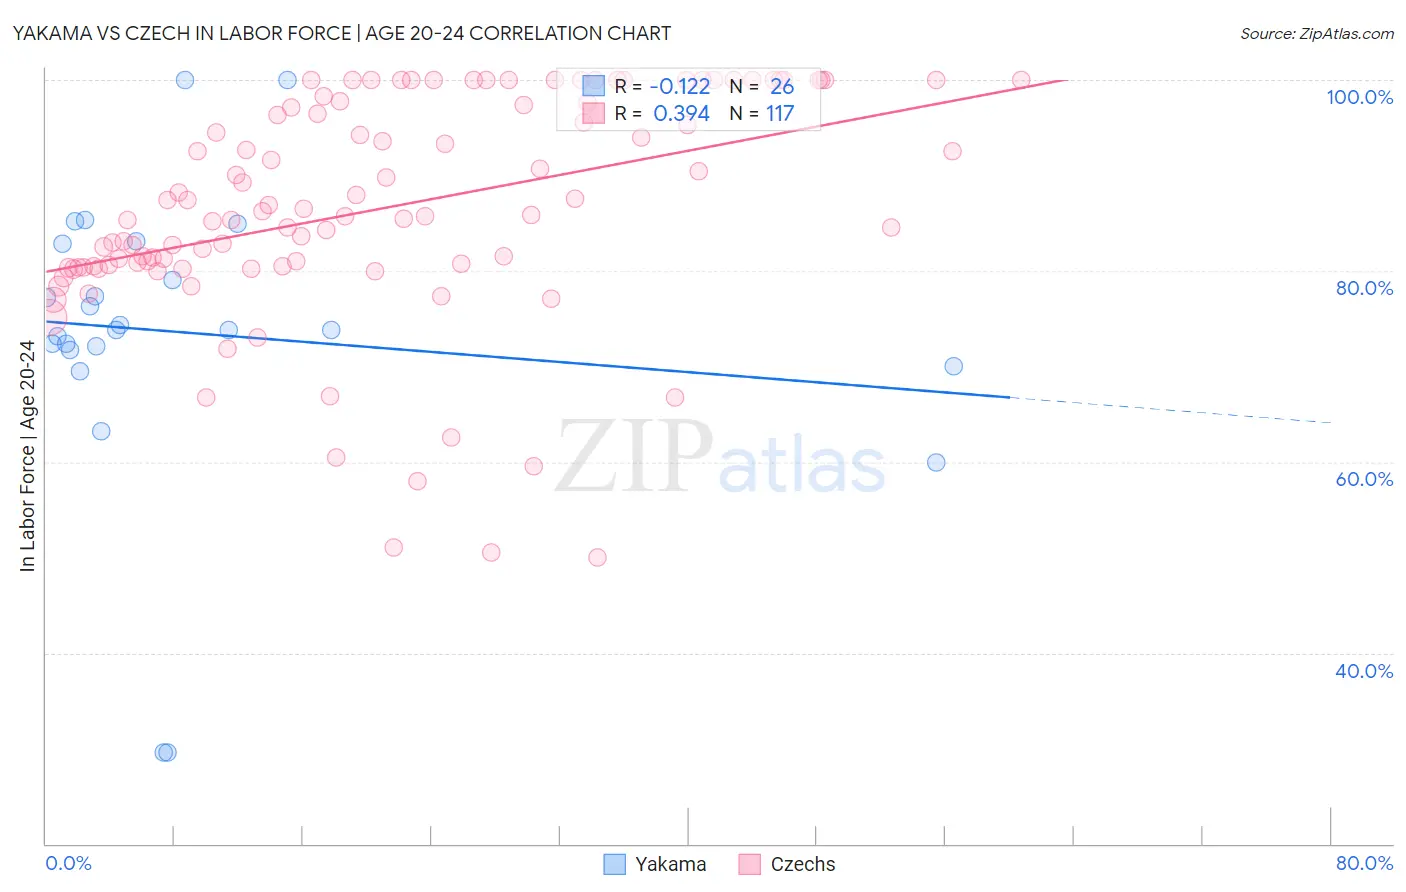
Yakama vs Czech In Labor Force | Age 20-24 Correlation Chart
The statistical analysis conducted on geographies consisting of 19,914,894 people shows a poor negative correlation between the proportion of Yakama and labor force participation rate among population between the ages 20 and 24 in the United States with a correlation coefficient (R) of -0.122 and weighted average of 75.1%. Similarly, the statistical analysis conducted on geographies consisting of 484,256,117 people shows a mild positive correlation between the proportion of Czechs and labor force participation rate among population between the ages 20 and 24 in the United States with a correlation coefficient (R) of 0.394 and weighted average of 78.5%, a difference of 4.6%.
In Labor Force | Age 20-24 Correlation Summary
| Measurement | Yakama | Czech |
| Minimum | 29.6% | 50.0% |
| Maximum | 100.0% | 100.0% |
| Range | 70.4% | 50.0% |
| Mean | 73.5% | 86.5% |
| Median | 73.8% | 85.9% |
| Interquartile 25% (IQ1) | 71.8% | 80.4% |
| Interquartile 75% (IQ3) | 82.9% | 97.7% |
| Interquartile Range (IQR) | 11.1% | 17.3% |
| Standard Deviation (Sample) | 15.8% | 11.8% |
| Standard Deviation (Population) | 15.5% | 11.7% |
Similar Demographics by In Labor Force | Age 20-24
Demographics Similar to Yakama by In Labor Force | Age 20-24
In terms of in labor force | age 20-24, the demographic groups most similar to Yakama are Cajun (75.1%, a difference of 0.010%), Immigrants from Croatia (75.1%, a difference of 0.010%), South African (75.0%, a difference of 0.010%), Mexican (75.1%, a difference of 0.020%), and Syrian (75.0%, a difference of 0.020%).
| Demographics | Rating | Rank | In Labor Force | Age 20-24 |
| Afghans | 63.5 /100 | #165 | Good 75.2% |
| Cambodians | 60.5 /100 | #166 | Good 75.2% |
| Immigrants | South Eastern Asia | 57.5 /100 | #167 | Average 75.1% |
| Immigrants | Western Africa | 56.7 /100 | #168 | Average 75.1% |
| Immigrants | Philippines | 55.8 /100 | #169 | Average 75.1% |
| Mexicans | 52.1 /100 | #170 | Average 75.1% |
| Cajuns | 51.1 /100 | #171 | Average 75.1% |
| Yakama | 50.8 /100 | #172 | Average 75.1% |
| Immigrants | Croatia | 50.2 /100 | #173 | Average 75.1% |
| South Africans | 50.0 /100 | #174 | Average 75.0% |
| Syrians | 49.5 /100 | #175 | Average 75.0% |
| Central Americans | 48.7 /100 | #176 | Average 75.0% |
| Immigrants | Mexico | 47.8 /100 | #177 | Average 75.0% |
| Immigrants | Central America | 45.0 /100 | #178 | Average 75.0% |
| Immigrants | Latvia | 44.1 /100 | #179 | Average 75.0% |
Demographics Similar to Czechs by In Labor Force | Age 20-24
In terms of in labor force | age 20-24, the demographic groups most similar to Czechs are Scandinavian (78.5%, a difference of 0.010%), German (78.6%, a difference of 0.070%), Sudanese (78.4%, a difference of 0.13%), Dutch (78.4%, a difference of 0.18%), and Finnish (78.7%, a difference of 0.19%).
| Demographics | Rating | Rank | In Labor Force | Age 20-24 |
| Luxembourgers | 100.0 /100 | #7 | Exceptional 79.0% |
| Immigrants | Cabo Verde | 100.0 /100 | #8 | Exceptional 78.9% |
| Swedes | 100.0 /100 | #9 | Exceptional 78.8% |
| Slovenes | 100.0 /100 | #10 | Exceptional 78.7% |
| Finns | 100.0 /100 | #11 | Exceptional 78.7% |
| Germans | 100.0 /100 | #12 | Exceptional 78.6% |
| Scandinavians | 100.0 /100 | #13 | Exceptional 78.5% |
| Czechs | 100.0 /100 | #14 | Exceptional 78.5% |
| Sudanese | 100.0 /100 | #15 | Exceptional 78.4% |
| Dutch | 100.0 /100 | #16 | Exceptional 78.4% |
| Cape Verdeans | 100.0 /100 | #17 | Exceptional 78.3% |
| Immigrants | Bosnia and Herzegovina | 100.0 /100 | #18 | Exceptional 78.1% |
| Bangladeshis | 100.0 /100 | #19 | Exceptional 78.1% |
| French Canadians | 100.0 /100 | #20 | Exceptional 78.1% |
| Puget Sound Salish | 100.0 /100 | #21 | Exceptional 78.0% |