Sri Lankan vs Immigrants from Thailand Female Poverty
COMPARE
Sri Lankan
Immigrants from Thailand
Female Poverty
Female Poverty Comparison
Sri Lankans
Immigrants from Thailand
12.7%
FEMALE POVERTY
90.9/ 100
METRIC RATING
118th/ 347
METRIC RANK
14.4%
FEMALE POVERTY
4.5/ 100
METRIC RATING
216th/ 347
METRIC RANK
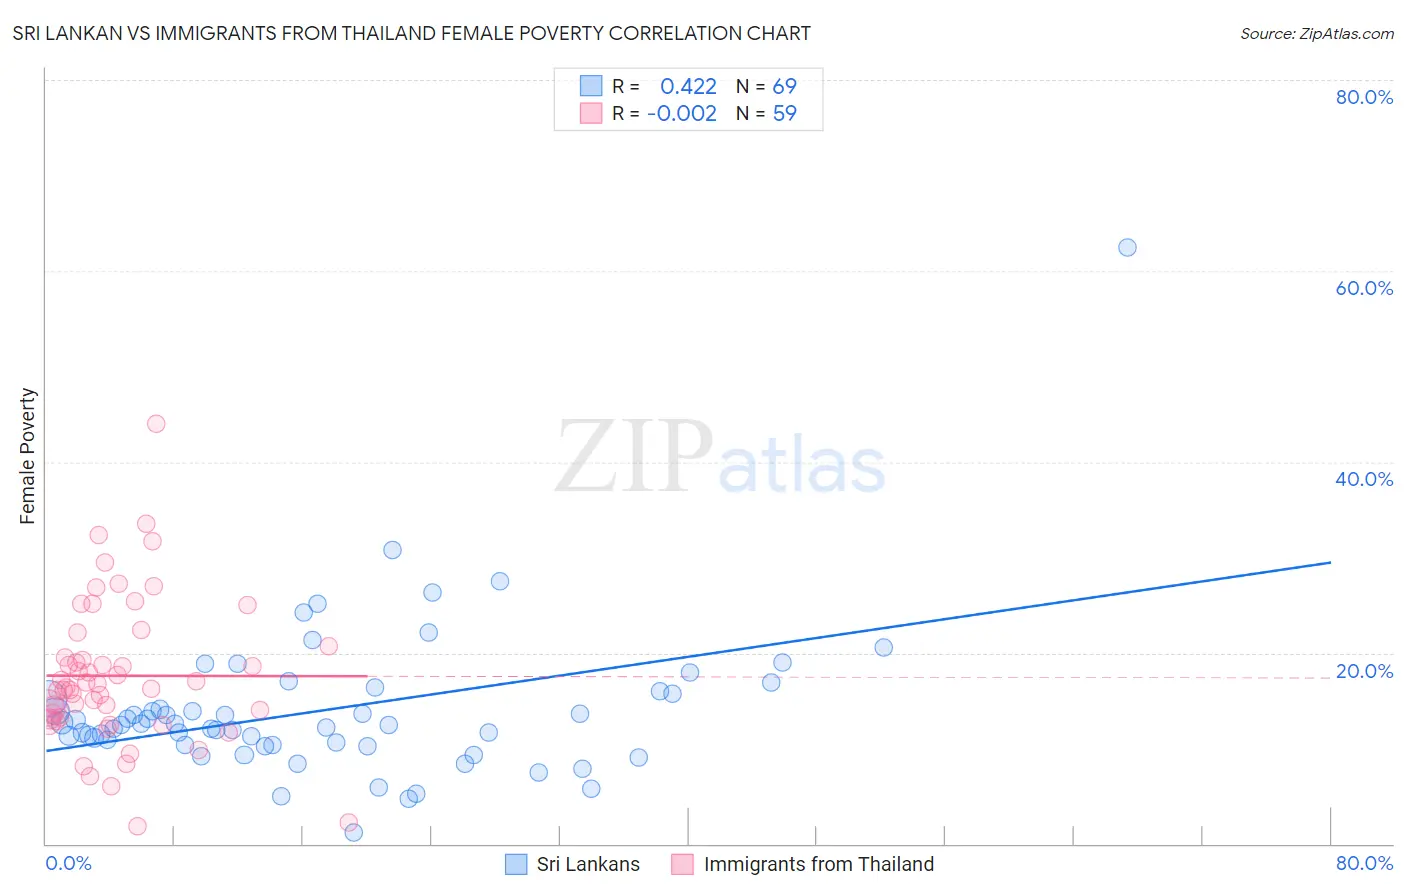
Sri Lankan vs Immigrants from Thailand Female Poverty Correlation Chart
The statistical analysis conducted on geographies consisting of 440,042,655 people shows a moderate positive correlation between the proportion of Sri Lankans and poverty level among females in the United States with a correlation coefficient (R) of 0.422 and weighted average of 12.7%. Similarly, the statistical analysis conducted on geographies consisting of 316,905,343 people shows no correlation between the proportion of Immigrants from Thailand and poverty level among females in the United States with a correlation coefficient (R) of -0.002 and weighted average of 14.4%, a difference of 13.6%.
Female Poverty Correlation Summary
| Measurement | Sri Lankan | Immigrants from Thailand |
| Minimum | 1.2% | 1.8% |
| Maximum | 62.5% | 44.1% |
| Range | 61.3% | 42.3% |
| Mean | 14.0% | 17.6% |
| Median | 12.5% | 16.4% |
| Interquartile 25% (IQ1) | 10.3% | 13.1% |
| Interquartile 75% (IQ3) | 15.8% | 20.7% |
| Interquartile Range (IQR) | 5.5% | 7.6% |
| Standard Deviation (Sample) | 8.1% | 7.7% |
| Standard Deviation (Population) | 8.0% | 7.6% |
Similar Demographics by Female Poverty
Demographics Similar to Sri Lankans by Female Poverty
In terms of female poverty, the demographic groups most similar to Sri Lankans are Albanian (12.7%, a difference of 0.010%), Immigrants from Southern Europe (12.7%, a difference of 0.020%), New Zealander (12.7%, a difference of 0.070%), Immigrants from Russia (12.7%, a difference of 0.090%), and Immigrants from Hungary (12.7%, a difference of 0.17%).
| Demographics | Rating | Rank | Female Poverty |
| Soviet Union | 92.4 /100 | #111 | Exceptional 12.6% |
| Immigrants | Israel | 92.0 /100 | #112 | Exceptional 12.6% |
| Canadians | 92.0 /100 | #113 | Exceptional 12.7% |
| Welsh | 91.6 /100 | #114 | Exceptional 12.7% |
| Puget Sound Salish | 91.5 /100 | #115 | Exceptional 12.7% |
| Immigrants | Russia | 91.2 /100 | #116 | Exceptional 12.7% |
| Immigrants | Southern Europe | 90.9 /100 | #117 | Exceptional 12.7% |
| Sri Lankans | 90.9 /100 | #118 | Exceptional 12.7% |
| Albanians | 90.8 /100 | #119 | Exceptional 12.7% |
| New Zealanders | 90.6 /100 | #120 | Exceptional 12.7% |
| Immigrants | Hungary | 90.3 /100 | #121 | Exceptional 12.7% |
| French Canadians | 90.2 /100 | #122 | Exceptional 12.7% |
| Immigrants | South Eastern Asia | 89.9 /100 | #123 | Excellent 12.7% |
| Immigrants | Norway | 89.3 /100 | #124 | Excellent 12.8% |
| Argentineans | 89.1 /100 | #125 | Excellent 12.8% |
Demographics Similar to Immigrants from Thailand by Female Poverty
In terms of female poverty, the demographic groups most similar to Immigrants from Thailand are Immigrants (14.4%, a difference of 0.030%), Immigrants from Uzbekistan (14.4%, a difference of 0.080%), Immigrants from Panama (14.4%, a difference of 0.090%), Japanese (14.5%, a difference of 0.22%), and Marshallese (14.4%, a difference of 0.23%).
| Demographics | Rating | Rank | Female Poverty |
| Panamanians | 7.7 /100 | #209 | Tragic 14.2% |
| Malaysians | 7.4 /100 | #210 | Tragic 14.3% |
| Moroccans | 7.2 /100 | #211 | Tragic 14.3% |
| Bermudans | 5.5 /100 | #212 | Tragic 14.4% |
| Alaskan Athabascans | 5.3 /100 | #213 | Tragic 14.4% |
| Marshallese | 5.0 /100 | #214 | Tragic 14.4% |
| Immigrants | Panama | 4.7 /100 | #215 | Tragic 14.4% |
| Immigrants | Thailand | 4.5 /100 | #216 | Tragic 14.4% |
| Immigrants | Immigrants | 4.5 /100 | #217 | Tragic 14.4% |
| Immigrants | Uzbekistan | 4.4 /100 | #218 | Tragic 14.4% |
| Japanese | 4.1 /100 | #219 | Tragic 14.5% |
| Alsatians | 4.0 /100 | #220 | Tragic 14.5% |
| Immigrants | Cambodia | 3.7 /100 | #221 | Tragic 14.5% |
| Immigrants | Nonimmigrants | 3.7 /100 | #222 | Tragic 14.5% |
| Immigrants | Africa | 3.3 /100 | #223 | Tragic 14.5% |