White/Caucasian vs Immigrants from Japan Seniors Poverty Over the Age of 65
COMPARE
White/Caucasian
Immigrants from Japan
Seniors Poverty Over the Age of 65
Seniors Poverty Over the Age of 65 Comparison
Whites/Caucasians
Immigrants from Japan
10.0%
SENIORS POVERTY OVER THE AGE OF 65
97.5/ 100
METRIC RATING
78th/ 347
METRIC RANK
10.1%
SENIORS POVERTY OVER THE AGE OF 65
96.3/ 100
METRIC RATING
95th/ 347
METRIC RANK
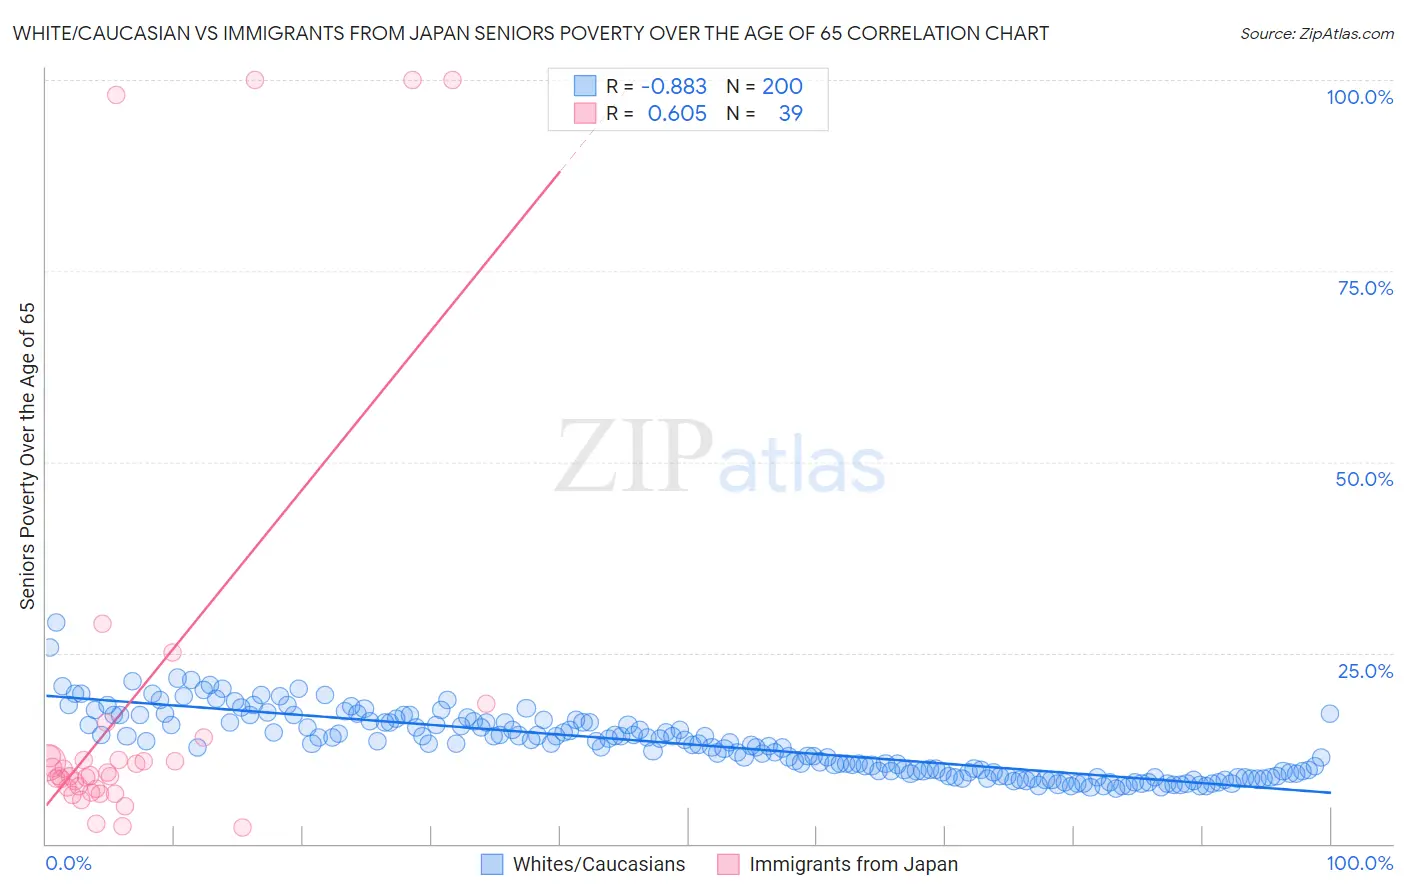
White/Caucasian vs Immigrants from Japan Seniors Poverty Over the Age of 65 Correlation Chart
The statistical analysis conducted on geographies consisting of 577,696,181 people shows a very strong negative correlation between the proportion of Whites/Caucasians and poverty level among seniors over the age of 65 in the United States with a correlation coefficient (R) of -0.883 and weighted average of 10.0%. Similarly, the statistical analysis conducted on geographies consisting of 339,182,731 people shows a significant positive correlation between the proportion of Immigrants from Japan and poverty level among seniors over the age of 65 in the United States with a correlation coefficient (R) of 0.605 and weighted average of 10.1%, a difference of 0.95%.
Seniors Poverty Over the Age of 65 Correlation Summary
| Measurement | White/Caucasian | Immigrants from Japan |
| Minimum | 7.2% | 2.1% |
| Maximum | 29.0% | 100.0% |
| Range | 21.8% | 97.9% |
| Mean | 13.0% | 19.0% |
| Median | 13.1% | 8.9% |
| Interquartile 25% (IQ1) | 9.2% | 7.2% |
| Interquartile 75% (IQ3) | 15.9% | 11.5% |
| Interquartile Range (IQR) | 6.7% | 4.2% |
| Standard Deviation (Sample) | 4.2% | 28.0% |
| Standard Deviation (Population) | 4.2% | 27.7% |
Demographics Similar to Whites/Caucasians and Immigrants from Japan by Seniors Poverty Over the Age of 65
In terms of seniors poverty over the age of 65, the demographic groups most similar to Whites/Caucasians are Immigrants from Ireland (10.0%, a difference of 0.010%), Korean (10.1%, a difference of 0.11%), Immigrants from Sri Lanka (10.1%, a difference of 0.14%), Immigrants from Bolivia (10.1%, a difference of 0.21%), and Immigrants from South Africa (10.0%, a difference of 0.24%). Similarly, the demographic groups most similar to Immigrants from Japan are Immigrants from Germany (10.1%, a difference of 0.23%), Basque (10.2%, a difference of 0.28%), Immigrants from Sweden (10.1%, a difference of 0.30%), Immigrants from Singapore (10.1%, a difference of 0.41%), and Puget Sound Salish (10.1%, a difference of 0.43%).
| Demographics | Rating | Rank | Seniors Poverty Over the Age of 65 |
| New Zealanders | 97.7 /100 | #76 | Exceptional 10.0% |
| Immigrants | South Africa | 97.7 /100 | #77 | Exceptional 10.0% |
| Whites/Caucasians | 97.5 /100 | #78 | Exceptional 10.0% |
| Immigrants | Ireland | 97.5 /100 | #79 | Exceptional 10.0% |
| Koreans | 97.4 /100 | #80 | Exceptional 10.1% |
| Immigrants | Sri Lanka | 97.3 /100 | #81 | Exceptional 10.1% |
| Immigrants | Bolivia | 97.3 /100 | #82 | Exceptional 10.1% |
| Immigrants | Poland | 97.2 /100 | #83 | Exceptional 10.1% |
| Immigrants | Afghanistan | 97.2 /100 | #84 | Exceptional 10.1% |
| Immigrants | Nepal | 97.2 /100 | #85 | Exceptional 10.1% |
| Romanians | 97.2 /100 | #86 | Exceptional 10.1% |
| Burmese | 97.2 /100 | #87 | Exceptional 10.1% |
| Jordanians | 97.1 /100 | #88 | Exceptional 10.1% |
| Immigrants | Bulgaria | 97.0 /100 | #89 | Exceptional 10.1% |
| Ukrainians | 96.9 /100 | #90 | Exceptional 10.1% |
| Puget Sound Salish | 96.9 /100 | #91 | Exceptional 10.1% |
| Immigrants | Singapore | 96.9 /100 | #92 | Exceptional 10.1% |
| Immigrants | Sweden | 96.7 /100 | #93 | Exceptional 10.1% |
| Immigrants | Germany | 96.7 /100 | #94 | Exceptional 10.1% |
| Immigrants | Japan | 96.3 /100 | #95 | Exceptional 10.1% |
| Basques | 95.9 /100 | #96 | Exceptional 10.2% |