Immigrants from Egypt vs Albanian Female Poverty Among 25-34 Year Olds
COMPARE
Immigrants from Egypt
Albanian
Female Poverty Among 25-34 Year Olds
Female Poverty Among 25-34 Year Olds Comparison
Immigrants from Egypt
Albanians
12.0%
FEMALE POVERTY AMONG 25-34 YEAR OLDS
99.6/ 100
METRIC RATING
49th/ 347
METRIC RANK
12.5%
FEMALE POVERTY AMONG 25-34 YEAR OLDS
97.7/ 100
METRIC RATING
83rd/ 347
METRIC RANK
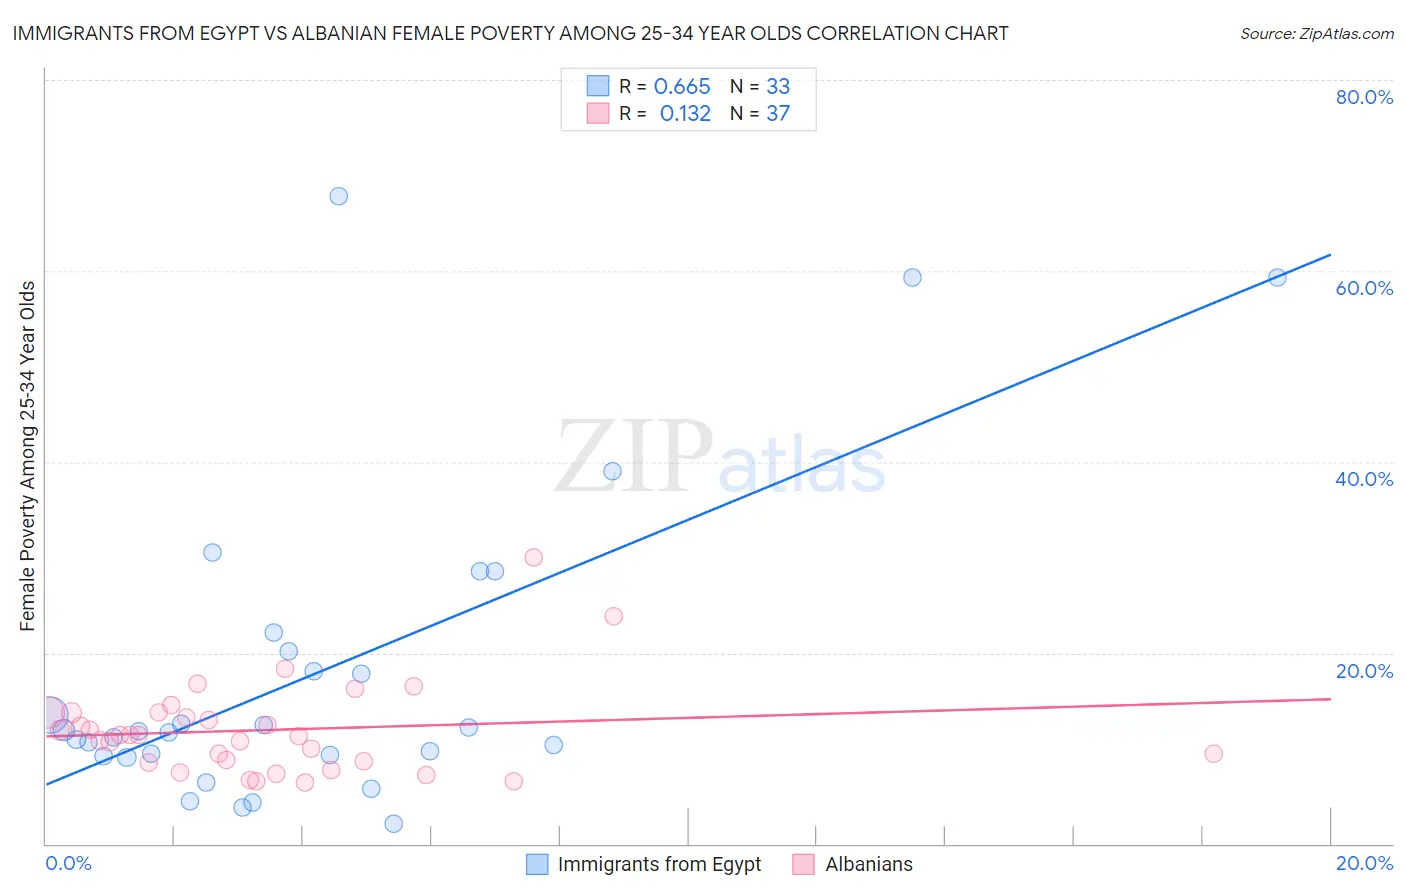
Immigrants from Egypt vs Albanian Female Poverty Among 25-34 Year Olds Correlation Chart
The statistical analysis conducted on geographies consisting of 242,883,921 people shows a significant positive correlation between the proportion of Immigrants from Egypt and poverty level among females between the ages 25 and 34 in the United States with a correlation coefficient (R) of 0.665 and weighted average of 12.0%. Similarly, the statistical analysis conducted on geographies consisting of 191,036,694 people shows a poor positive correlation between the proportion of Albanians and poverty level among females between the ages 25 and 34 in the United States with a correlation coefficient (R) of 0.132 and weighted average of 12.5%, a difference of 4.2%.
Female Poverty Among 25-34 Year Olds Correlation Summary
| Measurement | Immigrants from Egypt | Albanian |
| Minimum | 2.0% | 6.4% |
| Maximum | 67.8% | 30.0% |
| Range | 65.8% | 23.6% |
| Mean | 18.0% | 11.9% |
| Median | 11.8% | 11.4% |
| Interquartile 25% (IQ1) | 9.2% | 8.6% |
| Interquartile 75% (IQ3) | 21.2% | 13.7% |
| Interquartile Range (IQR) | 11.9% | 5.1% |
| Standard Deviation (Sample) | 16.5% | 4.8% |
| Standard Deviation (Population) | 16.2% | 4.8% |
Similar Demographics by Female Poverty Among 25-34 Year Olds
Demographics Similar to Immigrants from Egypt by Female Poverty Among 25-34 Year Olds
In terms of female poverty among 25-34 year olds, the demographic groups most similar to Immigrants from Egypt are Immigrants from Croatia (12.0%, a difference of 0.020%), Paraguayan (12.0%, a difference of 0.020%), Immigrants from Eastern Europe (12.0%, a difference of 0.040%), Immigrants from Belarus (12.0%, a difference of 0.080%), and Korean (12.0%, a difference of 0.13%).
| Demographics | Rating | Rank | Female Poverty Among 25-34 Year Olds |
| Immigrants | Turkey | 99.7 /100 | #42 | Exceptional 11.9% |
| Egyptians | 99.7 /100 | #43 | Exceptional 11.9% |
| Immigrants | Australia | 99.7 /100 | #44 | Exceptional 11.9% |
| Macedonians | 99.7 /100 | #45 | Exceptional 11.9% |
| Immigrants | Serbia | 99.7 /100 | #46 | Exceptional 11.9% |
| Koreans | 99.6 /100 | #47 | Exceptional 12.0% |
| Immigrants | Belarus | 99.6 /100 | #48 | Exceptional 12.0% |
| Immigrants | Egypt | 99.6 /100 | #49 | Exceptional 12.0% |
| Immigrants | Croatia | 99.6 /100 | #50 | Exceptional 12.0% |
| Paraguayans | 99.6 /100 | #51 | Exceptional 12.0% |
| Immigrants | Eastern Europe | 99.6 /100 | #52 | Exceptional 12.0% |
| Immigrants | Israel | 99.6 /100 | #53 | Exceptional 12.0% |
| Eastern Europeans | 99.6 /100 | #54 | Exceptional 12.0% |
| Immigrants | Philippines | 99.5 /100 | #55 | Exceptional 12.0% |
| Luxembourgers | 99.5 /100 | #56 | Exceptional 12.1% |
Demographics Similar to Albanians by Female Poverty Among 25-34 Year Olds
In terms of female poverty among 25-34 year olds, the demographic groups most similar to Albanians are Immigrants from Latvia (12.5%, a difference of 0.060%), Immigrants from South Eastern Asia (12.5%, a difference of 0.17%), Croatian (12.5%, a difference of 0.18%), Argentinean (12.5%, a difference of 0.21%), and Immigrants from Austria (12.5%, a difference of 0.28%).
| Demographics | Rating | Rank | Female Poverty Among 25-34 Year Olds |
| Greeks | 98.9 /100 | #76 | Exceptional 12.3% |
| Immigrants | Italy | 98.8 /100 | #77 | Exceptional 12.3% |
| Immigrants | Ukraine | 98.6 /100 | #78 | Exceptional 12.3% |
| Immigrants | Jordan | 98.5 /100 | #79 | Exceptional 12.4% |
| Immigrants | Malaysia | 98.3 /100 | #80 | Exceptional 12.4% |
| Immigrants | Kazakhstan | 98.1 /100 | #81 | Exceptional 12.4% |
| Ethiopians | 98.0 /100 | #82 | Exceptional 12.4% |
| Albanians | 97.7 /100 | #83 | Exceptional 12.5% |
| Immigrants | Latvia | 97.7 /100 | #84 | Exceptional 12.5% |
| Immigrants | South Eastern Asia | 97.6 /100 | #85 | Exceptional 12.5% |
| Croatians | 97.5 /100 | #86 | Exceptional 12.5% |
| Argentineans | 97.5 /100 | #87 | Exceptional 12.5% |
| Immigrants | Austria | 97.4 /100 | #88 | Exceptional 12.5% |
| Italians | 97.2 /100 | #89 | Exceptional 12.5% |
| Immigrants | Albania | 97.1 /100 | #90 | Exceptional 12.5% |