White/Caucasian vs Bulgarian Female Poverty Among 25-34 Year Olds
COMPARE
White/Caucasian
Bulgarian
Female Poverty Among 25-34 Year Olds
Female Poverty Among 25-34 Year Olds Comparison
Whites/Caucasians
Bulgarians
14.7%
FEMALE POVERTY AMONG 25-34 YEAR OLDS
1.8/ 100
METRIC RATING
233rd/ 347
METRIC RANK
11.5%
FEMALE POVERTY AMONG 25-34 YEAR OLDS
99.9/ 100
METRIC RATING
29th/ 347
METRIC RANK
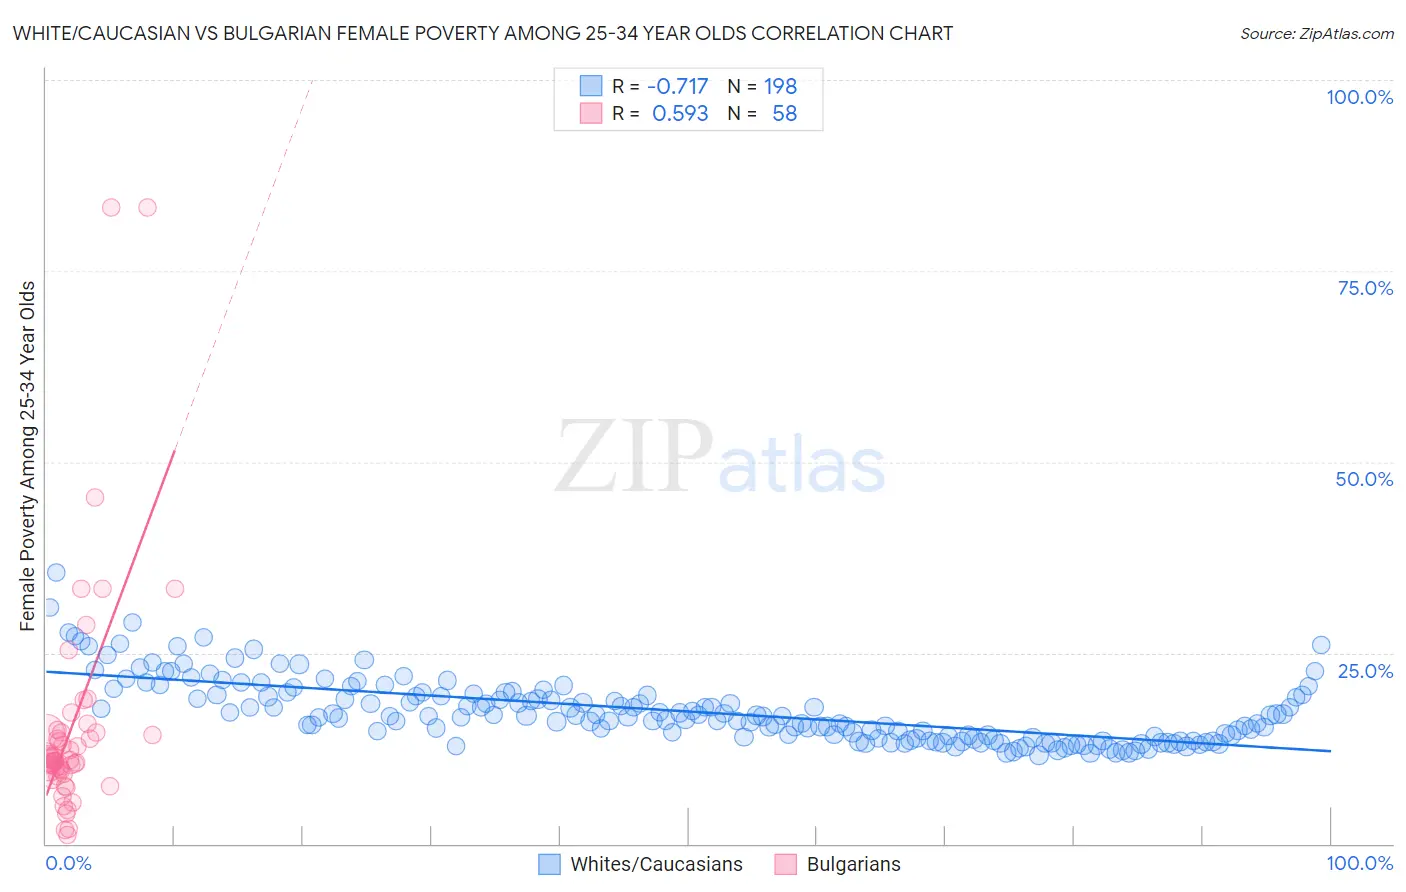
White/Caucasian vs Bulgarian Female Poverty Among 25-34 Year Olds Correlation Chart
The statistical analysis conducted on geographies consisting of 558,401,986 people shows a strong negative correlation between the proportion of Whites/Caucasians and poverty level among females between the ages 25 and 34 in the United States with a correlation coefficient (R) of -0.717 and weighted average of 14.7%. Similarly, the statistical analysis conducted on geographies consisting of 203,588,036 people shows a substantial positive correlation between the proportion of Bulgarians and poverty level among females between the ages 25 and 34 in the United States with a correlation coefficient (R) of 0.593 and weighted average of 11.5%, a difference of 27.2%.
Female Poverty Among 25-34 Year Olds Correlation Summary
| Measurement | White/Caucasian | Bulgarian |
| Minimum | 11.6% | 1.1% |
| Maximum | 35.4% | 83.3% |
| Range | 23.8% | 82.2% |
| Mean | 17.3% | 15.3% |
| Median | 16.7% | 10.9% |
| Interquartile 25% (IQ1) | 13.9% | 9.4% |
| Interquartile 75% (IQ3) | 19.4% | 14.6% |
| Interquartile Range (IQR) | 5.6% | 5.2% |
| Standard Deviation (Sample) | 4.2% | 15.3% |
| Standard Deviation (Population) | 4.2% | 15.2% |
Similar Demographics by Female Poverty Among 25-34 Year Olds
Demographics Similar to Whites/Caucasians by Female Poverty Among 25-34 Year Olds
In terms of female poverty among 25-34 year olds, the demographic groups most similar to Whites/Caucasians are Immigrants from Ecuador (14.6%, a difference of 0.18%), Cuban (14.7%, a difference of 0.23%), Immigrants from Jamaica (14.7%, a difference of 0.41%), Salvadoran (14.7%, a difference of 0.43%), and Immigrants from Ghana (14.7%, a difference of 0.43%).
| Demographics | Rating | Rank | Female Poverty Among 25-34 Year Olds |
| Nicaraguans | 3.3 /100 | #226 | Tragic 14.5% |
| Celtics | 2.8 /100 | #227 | Tragic 14.5% |
| Vietnamese | 2.6 /100 | #228 | Tragic 14.6% |
| Spanish | 2.5 /100 | #229 | Tragic 14.6% |
| Spaniards | 2.3 /100 | #230 | Tragic 14.6% |
| Delaware | 2.3 /100 | #231 | Tragic 14.6% |
| Immigrants | Ecuador | 1.9 /100 | #232 | Tragic 14.6% |
| Whites/Caucasians | 1.8 /100 | #233 | Tragic 14.7% |
| Cubans | 1.6 /100 | #234 | Tragic 14.7% |
| Immigrants | Jamaica | 1.4 /100 | #235 | Tragic 14.7% |
| Salvadorans | 1.4 /100 | #236 | Tragic 14.7% |
| Immigrants | Ghana | 1.4 /100 | #237 | Tragic 14.7% |
| Alsatians | 1.4 /100 | #238 | Tragic 14.7% |
| Malaysians | 1.4 /100 | #239 | Tragic 14.7% |
| Immigrants | Grenada | 1.3 /100 | #240 | Tragic 14.7% |
Demographics Similar to Bulgarians by Female Poverty Among 25-34 Year Olds
In terms of female poverty among 25-34 year olds, the demographic groups most similar to Bulgarians are Immigrants from Pakistan (11.5%, a difference of 0.0%), Cypriot (11.5%, a difference of 0.030%), Immigrants from Greece (11.5%, a difference of 0.24%), Immigrants from Japan (11.6%, a difference of 0.31%), and Tongan (11.5%, a difference of 0.54%).
| Demographics | Rating | Rank | Female Poverty Among 25-34 Year Olds |
| Asians | 99.9 /100 | #22 | Exceptional 11.4% |
| Bolivians | 99.9 /100 | #23 | Exceptional 11.4% |
| Maltese | 99.9 /100 | #24 | Exceptional 11.4% |
| Bhutanese | 99.9 /100 | #25 | Exceptional 11.4% |
| Tongans | 99.9 /100 | #26 | Exceptional 11.5% |
| Immigrants | Greece | 99.9 /100 | #27 | Exceptional 11.5% |
| Immigrants | Pakistan | 99.9 /100 | #28 | Exceptional 11.5% |
| Bulgarians | 99.9 /100 | #29 | Exceptional 11.5% |
| Cypriots | 99.9 /100 | #30 | Exceptional 11.5% |
| Immigrants | Japan | 99.9 /100 | #31 | Exceptional 11.6% |
| Immigrants | Asia | 99.9 /100 | #32 | Exceptional 11.6% |
| Immigrants | Poland | 99.9 /100 | #33 | Exceptional 11.6% |
| Zimbabweans | 99.9 /100 | #34 | Exceptional 11.7% |
| Cambodians | 99.9 /100 | #35 | Exceptional 11.7% |
| Immigrants | Sri Lanka | 99.8 /100 | #36 | Exceptional 11.8% |