Somali vs Albanian Female Poverty Among 25-34 Year Olds
COMPARE
Somali
Albanian
Female Poverty Among 25-34 Year Olds
Female Poverty Among 25-34 Year Olds Comparison
Somalis
Albanians
15.1%
FEMALE POVERTY AMONG 25-34 YEAR OLDS
0.4/ 100
METRIC RATING
254th/ 347
METRIC RANK
12.5%
FEMALE POVERTY AMONG 25-34 YEAR OLDS
97.7/ 100
METRIC RATING
83rd/ 347
METRIC RANK
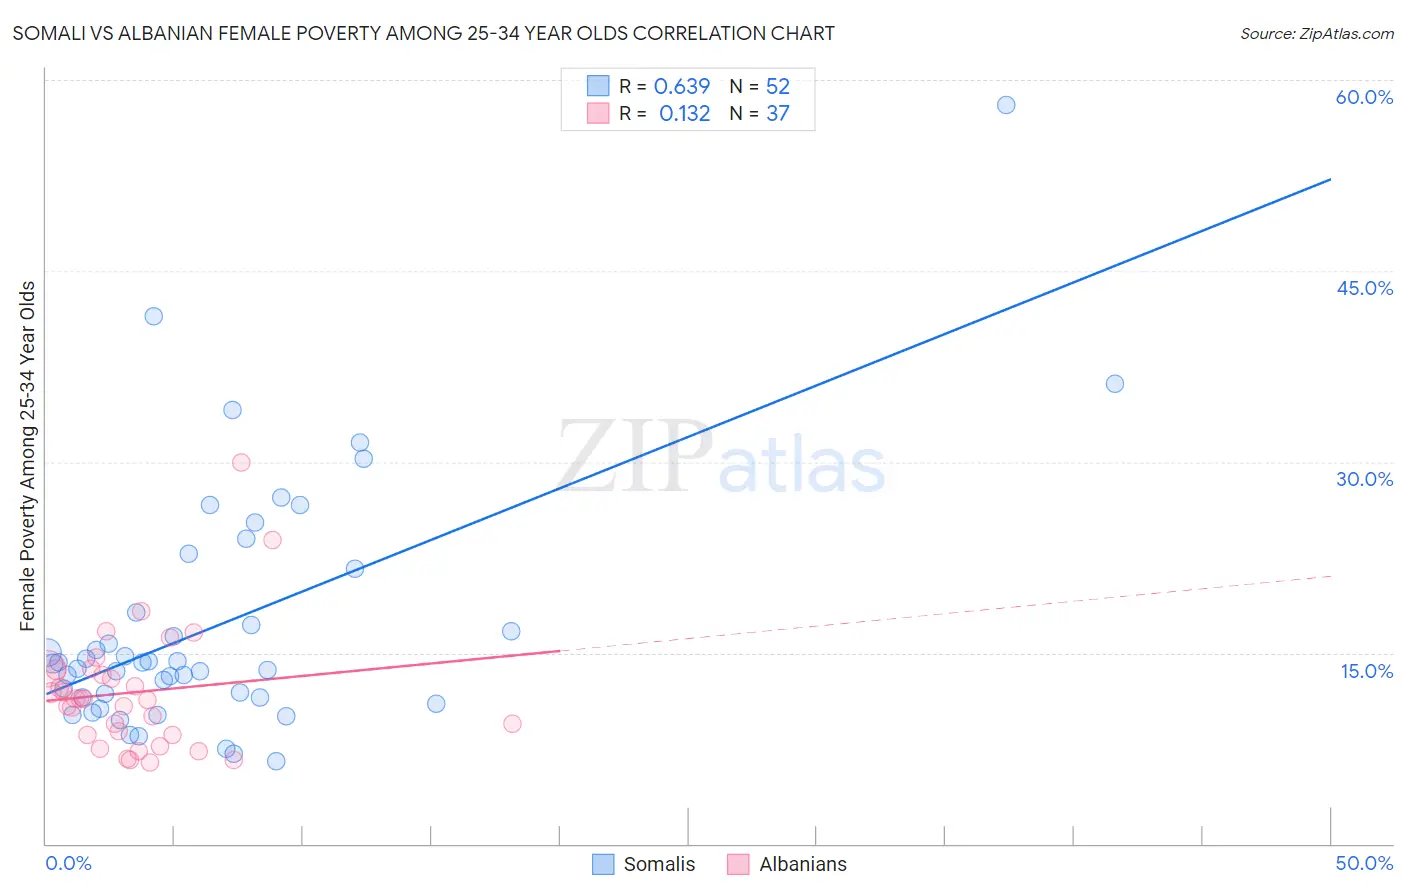
Somali vs Albanian Female Poverty Among 25-34 Year Olds Correlation Chart
The statistical analysis conducted on geographies consisting of 98,871,118 people shows a significant positive correlation between the proportion of Somalis and poverty level among females between the ages 25 and 34 in the United States with a correlation coefficient (R) of 0.639 and weighted average of 15.1%. Similarly, the statistical analysis conducted on geographies consisting of 191,036,694 people shows a poor positive correlation between the proportion of Albanians and poverty level among females between the ages 25 and 34 in the United States with a correlation coefficient (R) of 0.132 and weighted average of 12.5%, a difference of 21.0%.
Female Poverty Among 25-34 Year Olds Correlation Summary
| Measurement | Somali | Albanian |
| Minimum | 6.5% | 6.4% |
| Maximum | 58.1% | 30.0% |
| Range | 51.5% | 23.6% |
| Mean | 17.2% | 11.9% |
| Median | 14.2% | 11.4% |
| Interquartile 25% (IQ1) | 11.5% | 8.6% |
| Interquartile 75% (IQ3) | 19.9% | 13.7% |
| Interquartile Range (IQR) | 8.4% | 5.1% |
| Standard Deviation (Sample) | 9.7% | 4.8% |
| Standard Deviation (Population) | 9.7% | 4.8% |
Similar Demographics by Female Poverty Among 25-34 Year Olds
Demographics Similar to Somalis by Female Poverty Among 25-34 Year Olds
In terms of female poverty among 25-34 year olds, the demographic groups most similar to Somalis are Immigrants from West Indies (15.1%, a difference of 0.080%), Belizean (15.1%, a difference of 0.22%), Haitian (15.0%, a difference of 0.39%), Immigrants from Laos (15.2%, a difference of 0.39%), and West Indian (15.2%, a difference of 0.55%).
| Demographics | Rating | Rank | Female Poverty Among 25-34 Year Olds |
| German Russians | 0.8 /100 | #247 | Tragic 14.9% |
| Immigrants | Western Africa | 0.8 /100 | #248 | Tragic 14.9% |
| Immigrants | Haiti | 0.5 /100 | #249 | Tragic 15.0% |
| Immigrants | El Salvador | 0.5 /100 | #250 | Tragic 15.0% |
| Haitians | 0.5 /100 | #251 | Tragic 15.0% |
| Belizeans | 0.4 /100 | #252 | Tragic 15.1% |
| Immigrants | West Indies | 0.4 /100 | #253 | Tragic 15.1% |
| Somalis | 0.4 /100 | #254 | Tragic 15.1% |
| Immigrants | Laos | 0.3 /100 | #255 | Tragic 15.2% |
| West Indians | 0.3 /100 | #256 | Tragic 15.2% |
| Immigrants | Burma/Myanmar | 0.3 /100 | #257 | Tragic 15.2% |
| Nepalese | 0.2 /100 | #258 | Tragic 15.2% |
| Immigrants | Cuba | 0.2 /100 | #259 | Tragic 15.2% |
| Marshallese | 0.2 /100 | #260 | Tragic 15.3% |
| Liberians | 0.2 /100 | #261 | Tragic 15.3% |
Demographics Similar to Albanians by Female Poverty Among 25-34 Year Olds
In terms of female poverty among 25-34 year olds, the demographic groups most similar to Albanians are Immigrants from Latvia (12.5%, a difference of 0.060%), Immigrants from South Eastern Asia (12.5%, a difference of 0.17%), Croatian (12.5%, a difference of 0.18%), Argentinean (12.5%, a difference of 0.21%), and Immigrants from Austria (12.5%, a difference of 0.28%).
| Demographics | Rating | Rank | Female Poverty Among 25-34 Year Olds |
| Greeks | 98.9 /100 | #76 | Exceptional 12.3% |
| Immigrants | Italy | 98.8 /100 | #77 | Exceptional 12.3% |
| Immigrants | Ukraine | 98.6 /100 | #78 | Exceptional 12.3% |
| Immigrants | Jordan | 98.5 /100 | #79 | Exceptional 12.4% |
| Immigrants | Malaysia | 98.3 /100 | #80 | Exceptional 12.4% |
| Immigrants | Kazakhstan | 98.1 /100 | #81 | Exceptional 12.4% |
| Ethiopians | 98.0 /100 | #82 | Exceptional 12.4% |
| Albanians | 97.7 /100 | #83 | Exceptional 12.5% |
| Immigrants | Latvia | 97.7 /100 | #84 | Exceptional 12.5% |
| Immigrants | South Eastern Asia | 97.6 /100 | #85 | Exceptional 12.5% |
| Croatians | 97.5 /100 | #86 | Exceptional 12.5% |
| Argentineans | 97.5 /100 | #87 | Exceptional 12.5% |
| Immigrants | Austria | 97.4 /100 | #88 | Exceptional 12.5% |
| Italians | 97.2 /100 | #89 | Exceptional 12.5% |
| Immigrants | Albania | 97.1 /100 | #90 | Exceptional 12.5% |