West Indian vs Paiute Poverty
COMPARE
West Indian
Paiute
Poverty
Poverty Comparison
West Indians
Paiute
15.0%
POVERTY
0.0/ 100
METRIC RATING
284th/ 347
METRIC RANK
16.7%
POVERTY
0.0/ 100
METRIC RATING
326th/ 347
METRIC RANK
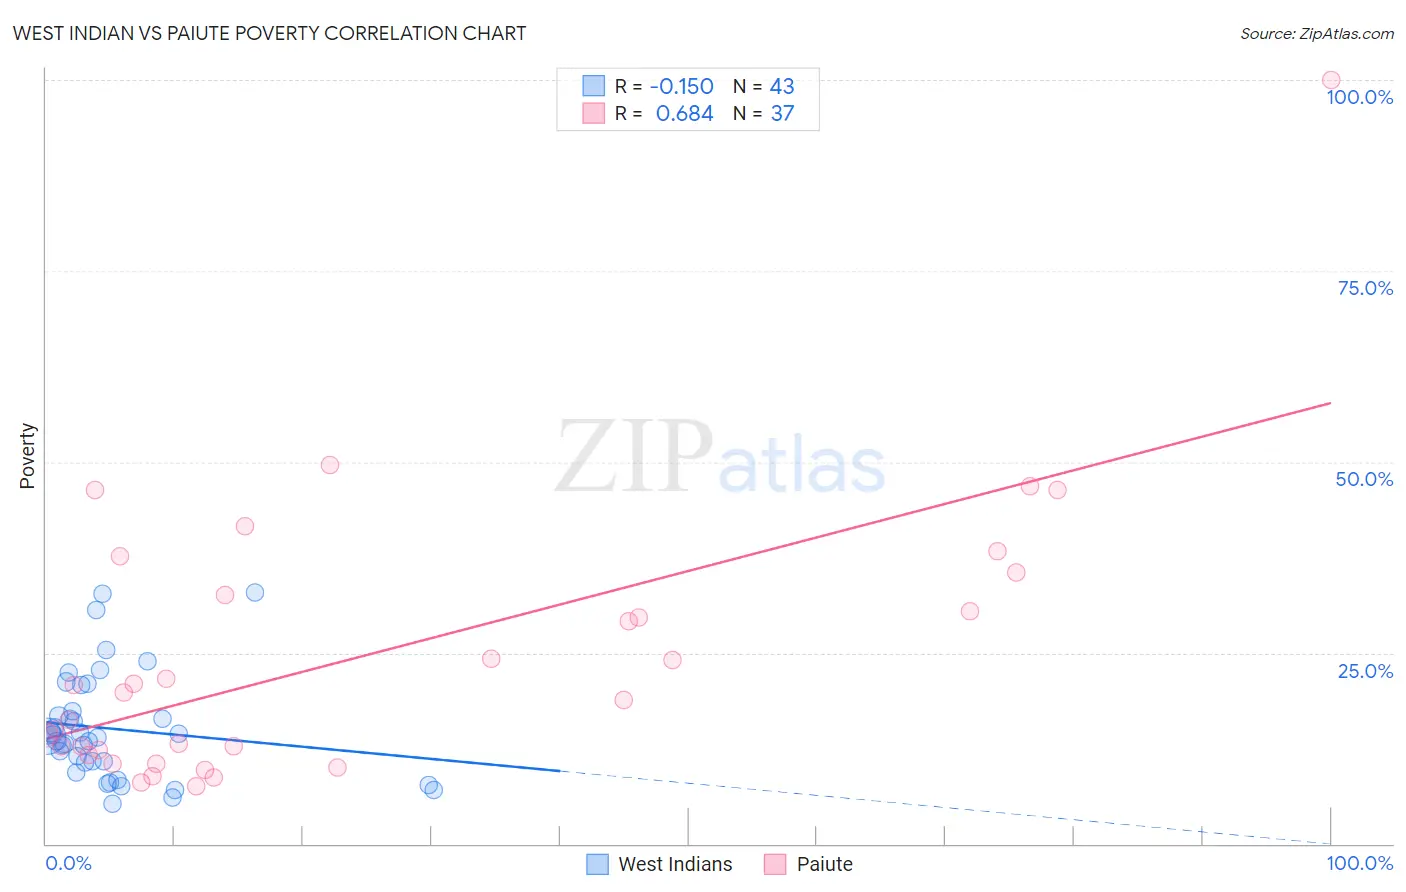
West Indian vs Paiute Poverty Correlation Chart
The statistical analysis conducted on geographies consisting of 253,897,912 people shows a poor negative correlation between the proportion of West Indians and poverty level in the United States with a correlation coefficient (R) of -0.150 and weighted average of 15.0%. Similarly, the statistical analysis conducted on geographies consisting of 58,392,154 people shows a significant positive correlation between the proportion of Paiute and poverty level in the United States with a correlation coefficient (R) of 0.684 and weighted average of 16.7%, a difference of 11.7%.
Poverty Correlation Summary
| Measurement | West Indian | Paiute |
| Minimum | 5.3% | 7.5% |
| Maximum | 32.8% | 100.0% |
| Range | 27.5% | 92.5% |
| Mean | 15.1% | 24.5% |
| Median | 14.1% | 19.8% |
| Interquartile 25% (IQ1) | 10.6% | 11.9% |
| Interquartile 75% (IQ3) | 17.3% | 34.1% |
| Interquartile Range (IQR) | 6.7% | 22.1% |
| Standard Deviation (Sample) | 6.9% | 18.1% |
| Standard Deviation (Population) | 6.8% | 17.9% |
Similar Demographics by Poverty
Demographics Similar to West Indians by Poverty
In terms of poverty, the demographic groups most similar to West Indians are Vietnamese (15.0%, a difference of 0.050%), Immigrants from Haiti (15.0%, a difference of 0.10%), Comanche (15.0%, a difference of 0.23%), Immigrants from Latin America (15.0%, a difference of 0.32%), and Inupiat (15.1%, a difference of 0.53%).
| Demographics | Rating | Rank | Poverty |
| Bangladeshis | 0.0 /100 | #277 | Tragic 14.8% |
| Belizeans | 0.0 /100 | #278 | Tragic 14.8% |
| Immigrants | St. Vincent and the Grenadines | 0.0 /100 | #279 | Tragic 14.9% |
| Haitians | 0.0 /100 | #280 | Tragic 14.9% |
| Immigrants | Barbados | 0.0 /100 | #281 | Tragic 14.9% |
| Comanche | 0.0 /100 | #282 | Tragic 15.0% |
| Immigrants | Haiti | 0.0 /100 | #283 | Tragic 15.0% |
| West Indians | 0.0 /100 | #284 | Tragic 15.0% |
| Vietnamese | 0.0 /100 | #285 | Tragic 15.0% |
| Immigrants | Latin America | 0.0 /100 | #286 | Tragic 15.0% |
| Inupiat | 0.0 /100 | #287 | Tragic 15.1% |
| Yaqui | 0.0 /100 | #288 | Tragic 15.1% |
| Immigrants | Belize | 0.0 /100 | #289 | Tragic 15.1% |
| Mexicans | 0.0 /100 | #290 | Tragic 15.1% |
| Immigrants | Cabo Verde | 0.0 /100 | #291 | Tragic 15.1% |
Demographics Similar to Paiute by Poverty
In terms of poverty, the demographic groups most similar to Paiute are Central American Indian (16.7%, a difference of 0.29%), Yakama (16.7%, a difference of 0.52%), Kiowa (16.8%, a difference of 0.53%), Ute (16.9%, a difference of 0.96%), and Colville (16.6%, a difference of 1.1%).
| Demographics | Rating | Rank | Poverty |
| Immigrants | Congo | 0.0 /100 | #319 | Tragic 16.1% |
| Immigrants | Honduras | 0.0 /100 | #320 | Tragic 16.2% |
| Arapaho | 0.0 /100 | #321 | Tragic 16.3% |
| Menominee | 0.0 /100 | #322 | Tragic 16.4% |
| Colville | 0.0 /100 | #323 | Tragic 16.6% |
| Yakama | 0.0 /100 | #324 | Tragic 16.7% |
| Central American Indians | 0.0 /100 | #325 | Tragic 16.7% |
| Paiute | 0.0 /100 | #326 | Tragic 16.7% |
| Kiowa | 0.0 /100 | #327 | Tragic 16.8% |
| Ute | 0.0 /100 | #328 | Tragic 16.9% |
| Blacks/African Americans | 0.0 /100 | #329 | Tragic 17.3% |
| Dominicans | 0.0 /100 | #330 | Tragic 17.6% |
| Immigrants | Dominican Republic | 0.0 /100 | #331 | Tragic 17.8% |
| Natives/Alaskans | 0.0 /100 | #332 | Tragic 18.1% |
| Houma | 0.0 /100 | #333 | Tragic 18.4% |