West Indian vs Immigrants from China 1st Grade
COMPARE
West Indian
Immigrants from China
1st Grade
1st Grade Comparison
West Indians
Immigrants from China
97.5%
1ST GRADE
0.3/ 100
METRIC RATING
269th/ 347
METRIC RANK
97.4%
1ST GRADE
0.1/ 100
METRIC RATING
275th/ 347
METRIC RANK
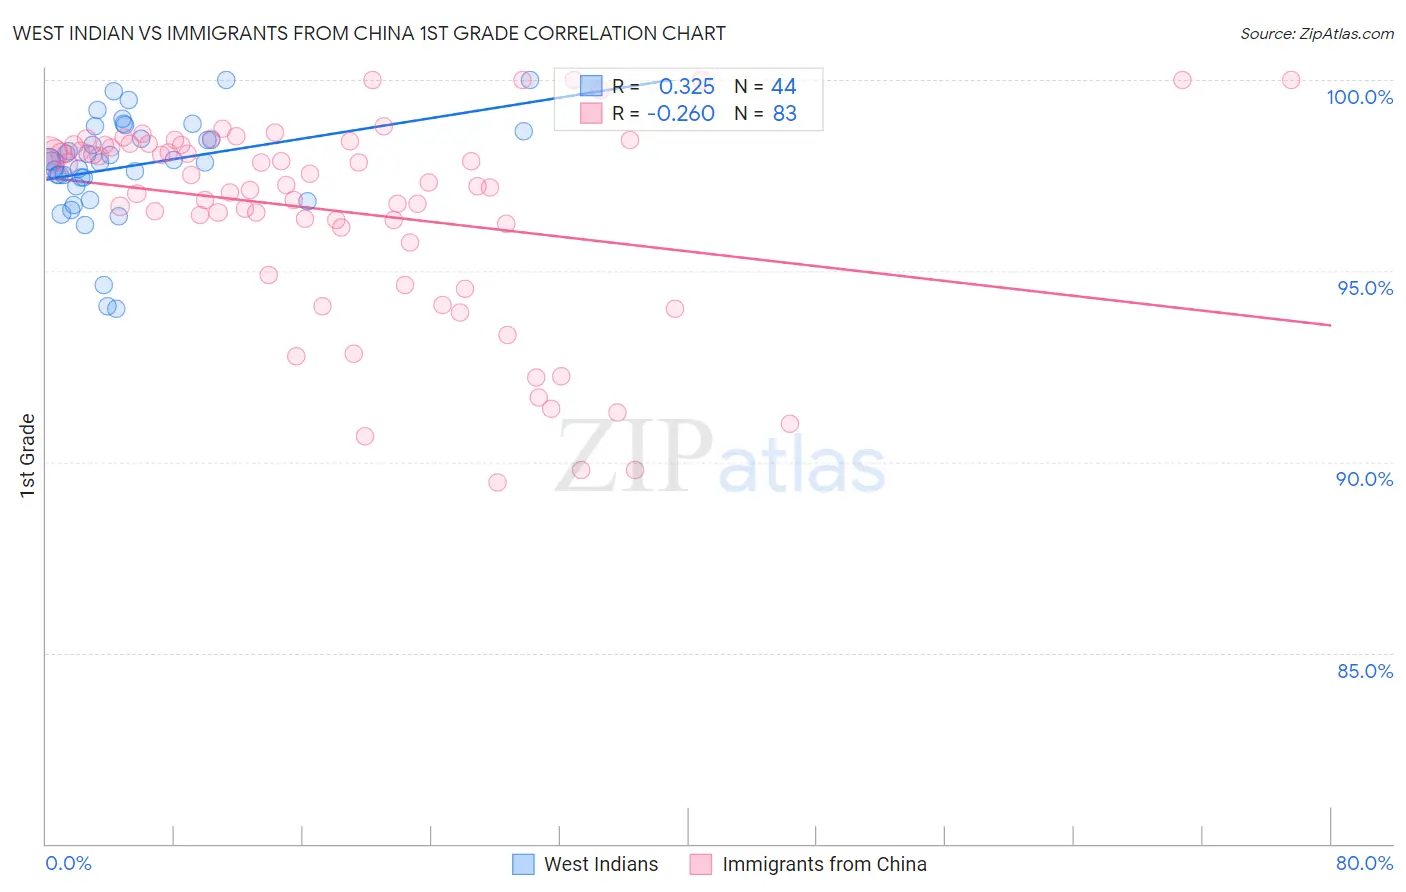
West Indian vs Immigrants from China 1st Grade Correlation Chart
The statistical analysis conducted on geographies consisting of 254,063,654 people shows a mild positive correlation between the proportion of West Indians and percentage of population with at least 1st grade education in the United States with a correlation coefficient (R) of 0.325 and weighted average of 97.5%. Similarly, the statistical analysis conducted on geographies consisting of 457,082,957 people shows a weak negative correlation between the proportion of Immigrants from China and percentage of population with at least 1st grade education in the United States with a correlation coefficient (R) of -0.260 and weighted average of 97.4%, a difference of 0.070%.
1st Grade Correlation Summary
| Measurement | West Indian | Immigrants from China |
| Minimum | 94.0% | 89.5% |
| Maximum | 100.0% | 100.0% |
| Range | 6.0% | 10.5% |
| Mean | 97.7% | 96.5% |
| Median | 97.9% | 97.3% |
| Interquartile 25% (IQ1) | 97.3% | 95.7% |
| Interquartile 75% (IQ3) | 98.6% | 98.3% |
| Interquartile Range (IQR) | 1.2% | 2.6% |
| Standard Deviation (Sample) | 1.3% | 2.6% |
| Standard Deviation (Population) | 1.3% | 2.6% |
Demographics Similar to West Indians and Immigrants from China by 1st Grade
In terms of 1st grade, the demographic groups most similar to West Indians are Immigrants from Sierra Leone (97.5%, a difference of 0.010%), Immigrants from Nigeria (97.5%, a difference of 0.010%), Cuban (97.5%, a difference of 0.020%), Immigrants from Liberia (97.5%, a difference of 0.020%), and Immigrants from Jamaica (97.5%, a difference of 0.020%). Similarly, the demographic groups most similar to Immigrants from China are Ghanaian (97.4%, a difference of 0.0%), Immigrants from Philippines (97.4%, a difference of 0.020%), Immigrants from Western Africa (97.4%, a difference of 0.020%), Immigrants from Bolivia (97.4%, a difference of 0.030%), and Immigrants from Cameroon (97.4%, a difference of 0.040%).
| Demographics | Rating | Rank | 1st Grade |
| Assyrians/Chaldeans/Syriacs | 0.4 /100 | #262 | Tragic 97.5% |
| Immigrants | South America | 0.4 /100 | #263 | Tragic 97.5% |
| Taiwanese | 0.4 /100 | #264 | Tragic 97.5% |
| Cubans | 0.3 /100 | #265 | Tragic 97.5% |
| Immigrants | Liberia | 0.3 /100 | #266 | Tragic 97.5% |
| Immigrants | Sierra Leone | 0.3 /100 | #267 | Tragic 97.5% |
| Immigrants | Nigeria | 0.3 /100 | #268 | Tragic 97.5% |
| West Indians | 0.3 /100 | #269 | Tragic 97.5% |
| Immigrants | Jamaica | 0.2 /100 | #270 | Tragic 97.5% |
| Immigrants | Cameroon | 0.2 /100 | #271 | Tragic 97.4% |
| Immigrants | Peru | 0.2 /100 | #272 | Tragic 97.4% |
| Immigrants | Bolivia | 0.2 /100 | #273 | Tragic 97.4% |
| Ghanaians | 0.1 /100 | #274 | Tragic 97.4% |
| Immigrants | China | 0.1 /100 | #275 | Tragic 97.4% |
| Immigrants | Philippines | 0.1 /100 | #276 | Tragic 97.4% |
| Immigrants | Western Africa | 0.1 /100 | #277 | Tragic 97.4% |
| Immigrants | Uzbekistan | 0.1 /100 | #278 | Tragic 97.4% |
| Immigrants | Ghana | 0.1 /100 | #279 | Tragic 97.4% |
| Afghans | 0.1 /100 | #280 | Tragic 97.4% |
| Trinidadians and Tobagonians | 0.1 /100 | #281 | Tragic 97.3% |
| Barbadians | 0.1 /100 | #282 | Tragic 97.3% |