West Indian vs Choctaw Male Poverty
COMPARE
West Indian
Choctaw
Male Poverty
Male Poverty Comparison
West Indians
Choctaw
13.8%
MALE POVERTY
0.0/ 100
METRIC RATING
285th/ 347
METRIC RANK
14.4%
MALE POVERTY
0.0/ 100
METRIC RATING
312th/ 347
METRIC RANK
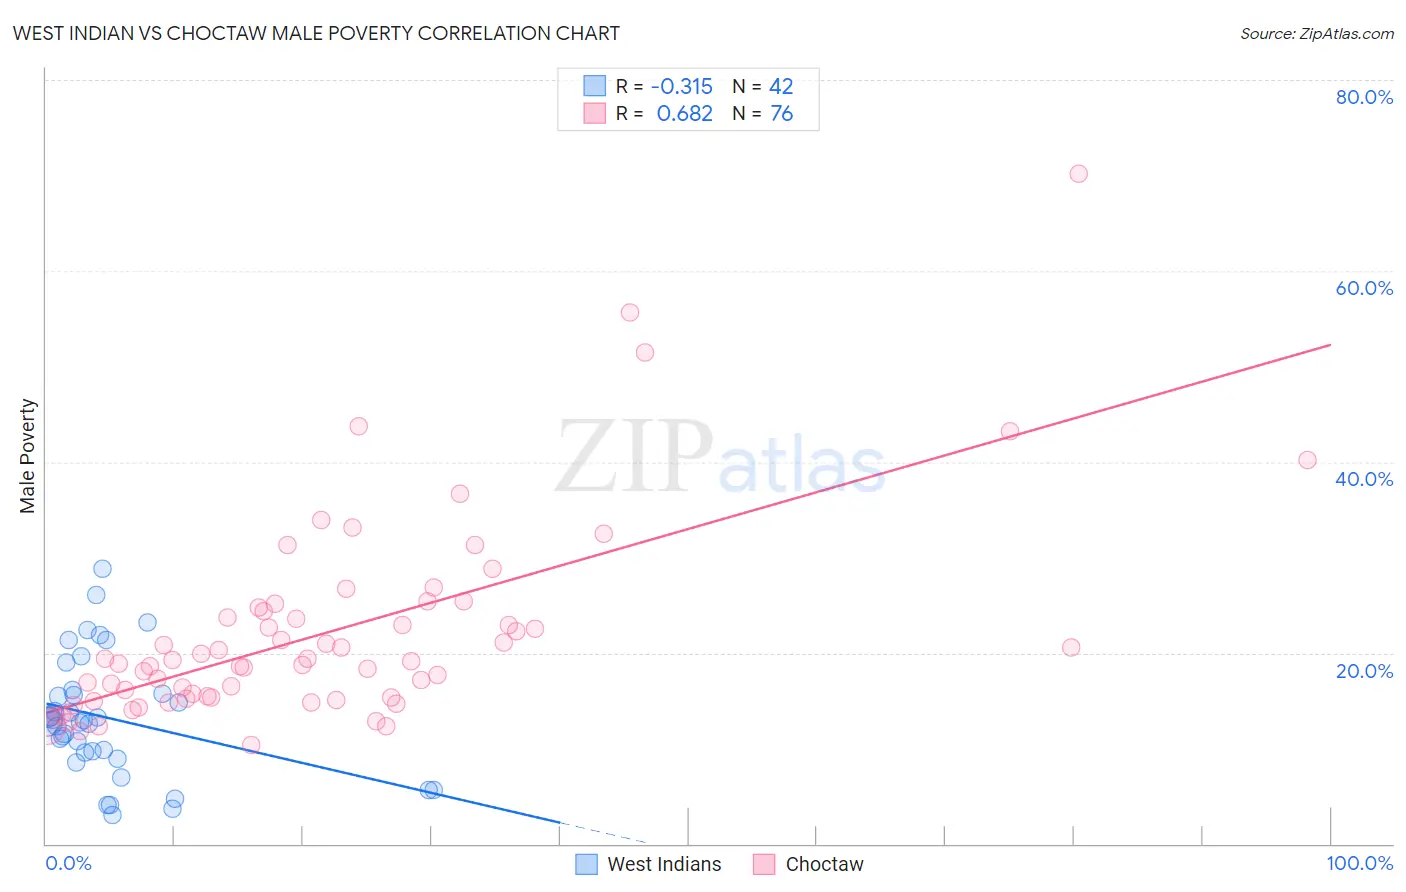
West Indian vs Choctaw Male Poverty Correlation Chart
The statistical analysis conducted on geographies consisting of 253,851,843 people shows a mild negative correlation between the proportion of West Indians and poverty level among males in the United States with a correlation coefficient (R) of -0.315 and weighted average of 13.8%. Similarly, the statistical analysis conducted on geographies consisting of 269,566,788 people shows a significant positive correlation between the proportion of Choctaw and poverty level among males in the United States with a correlation coefficient (R) of 0.682 and weighted average of 14.4%, a difference of 4.6%.
Male Poverty Correlation Summary
| Measurement | West Indian | Choctaw |
| Minimum | 3.0% | 10.4% |
| Maximum | 28.8% | 70.2% |
| Range | 25.8% | 59.8% |
| Mean | 13.2% | 22.2% |
| Median | 12.9% | 19.2% |
| Interquartile 25% (IQ1) | 9.6% | 15.3% |
| Interquartile 75% (IQ3) | 15.8% | 24.6% |
| Interquartile Range (IQR) | 6.2% | 9.3% |
| Standard Deviation (Sample) | 6.2% | 10.5% |
| Standard Deviation (Population) | 6.2% | 10.5% |
Similar Demographics by Male Poverty
Demographics Similar to West Indians by Male Poverty
In terms of male poverty, the demographic groups most similar to West Indians are Immigrants from Haiti (13.8%, a difference of 0.010%), Comanche (13.8%, a difference of 0.020%), Shoshone (13.8%, a difference of 0.030%), Immigrants from Barbados (13.8%, a difference of 0.050%), and Immigrants from St. Vincent and the Grenadines (13.8%, a difference of 0.22%).
| Demographics | Rating | Rank | Male Poverty |
| Belizeans | 0.0 /100 | #278 | Tragic 13.6% |
| Haitians | 0.0 /100 | #279 | Tragic 13.7% |
| Mexicans | 0.0 /100 | #280 | Tragic 13.7% |
| Yaqui | 0.0 /100 | #281 | Tragic 13.7% |
| Immigrants | Cabo Verde | 0.0 /100 | #282 | Tragic 13.7% |
| Comanche | 0.0 /100 | #283 | Tragic 13.8% |
| Immigrants | Haiti | 0.0 /100 | #284 | Tragic 13.8% |
| West Indians | 0.0 /100 | #285 | Tragic 13.8% |
| Shoshone | 0.0 /100 | #286 | Tragic 13.8% |
| Immigrants | Barbados | 0.0 /100 | #287 | Tragic 13.8% |
| Immigrants | St. Vincent and the Grenadines | 0.0 /100 | #288 | Tragic 13.8% |
| Guatemalans | 0.0 /100 | #289 | Tragic 13.8% |
| Immigrants | Zaire | 0.0 /100 | #290 | Tragic 13.8% |
| Vietnamese | 0.0 /100 | #291 | Tragic 13.8% |
| Indonesians | 0.0 /100 | #292 | Tragic 13.8% |
Demographics Similar to Choctaw by Male Poverty
In terms of male poverty, the demographic groups most similar to Choctaw are Honduran (14.3%, a difference of 0.47%), Seminole (14.3%, a difference of 0.67%), Somali (14.3%, a difference of 0.88%), African (14.2%, a difference of 1.3%), and Dutch West Indian (14.2%, a difference of 1.3%).
| Demographics | Rating | Rank | Male Poverty |
| Immigrants | Bangladesh | 0.0 /100 | #305 | Tragic 14.1% |
| Creek | 0.0 /100 | #306 | Tragic 14.1% |
| Dutch West Indians | 0.0 /100 | #307 | Tragic 14.2% |
| Africans | 0.0 /100 | #308 | Tragic 14.2% |
| Somalis | 0.0 /100 | #309 | Tragic 14.3% |
| Seminole | 0.0 /100 | #310 | Tragic 14.3% |
| Hondurans | 0.0 /100 | #311 | Tragic 14.3% |
| Choctaw | 0.0 /100 | #312 | Tragic 14.4% |
| Immigrants | Somalia | 0.0 /100 | #313 | Tragic 14.6% |
| Immigrants | Honduras | 0.0 /100 | #314 | Tragic 14.6% |
| Chippewa | 0.0 /100 | #315 | Tragic 14.6% |
| British West Indians | 0.0 /100 | #316 | Tragic 14.6% |
| Immigrants | Dominica | 0.0 /100 | #317 | Tragic 14.7% |
| Immigrants | Grenada | 0.0 /100 | #318 | Tragic 14.7% |
| U.S. Virgin Islanders | 0.0 /100 | #319 | Tragic 14.7% |