Vietnamese vs Immigrants from Northern Europe Child Poverty Among Boys Under 16
COMPARE
Vietnamese
Immigrants from Northern Europe
Child Poverty Among Boys Under 16
Child Poverty Among Boys Under 16 Comparison
Vietnamese
Immigrants from Northern Europe
19.6%
CHILD POVERTY AMONG BOYS UNDER 16
0.1/ 100
METRIC RATING
267th/ 347
METRIC RANK
13.9%
CHILD POVERTY AMONG BOYS UNDER 16
99.6/ 100
METRIC RATING
38th/ 347
METRIC RANK
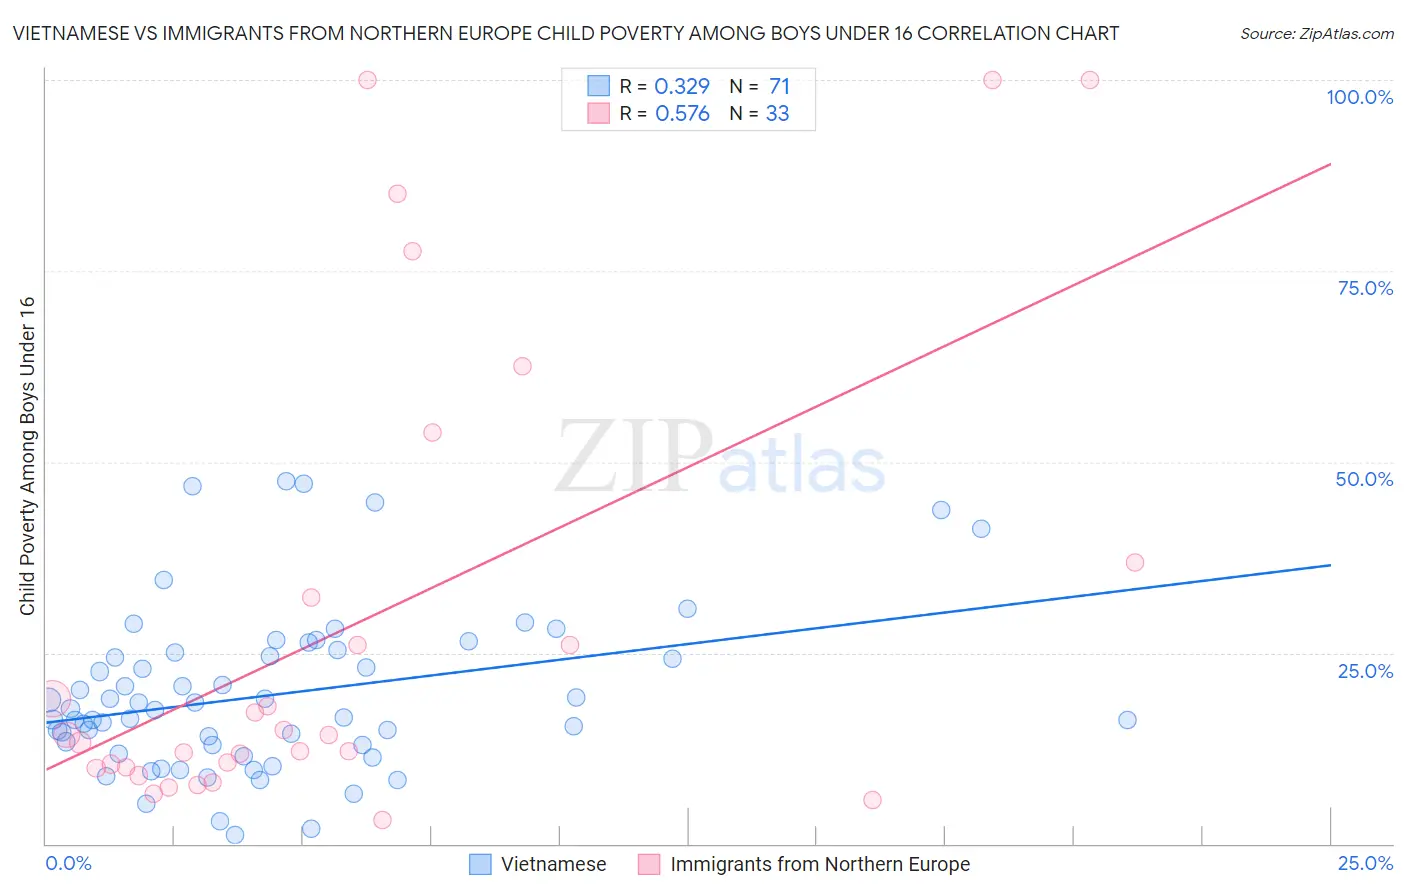
Vietnamese vs Immigrants from Northern Europe Child Poverty Among Boys Under 16 Correlation Chart
The statistical analysis conducted on geographies consisting of 169,843,059 people shows a mild positive correlation between the proportion of Vietnamese and poverty level among boys under the age of 16 in the United States with a correlation coefficient (R) of 0.329 and weighted average of 19.6%. Similarly, the statistical analysis conducted on geographies consisting of 464,912,892 people shows a substantial positive correlation between the proportion of Immigrants from Northern Europe and poverty level among boys under the age of 16 in the United States with a correlation coefficient (R) of 0.576 and weighted average of 13.9%, a difference of 41.1%.
Child Poverty Among Boys Under 16 Correlation Summary
| Measurement | Vietnamese | Immigrants from Northern Europe |
| Minimum | 1.2% | 3.1% |
| Maximum | 47.5% | 100.0% |
| Range | 46.4% | 96.9% |
| Mean | 19.5% | 28.7% |
| Median | 17.5% | 14.2% |
| Interquartile 25% (IQ1) | 12.9% | 10.0% |
| Interquartile 75% (IQ3) | 25.0% | 34.6% |
| Interquartile Range (IQR) | 12.1% | 24.6% |
| Standard Deviation (Sample) | 10.6% | 30.5% |
| Standard Deviation (Population) | 10.5% | 30.0% |
Similar Demographics by Child Poverty Among Boys Under 16
Demographics Similar to Vietnamese by Child Poverty Among Boys Under 16
In terms of child poverty among boys under 16, the demographic groups most similar to Vietnamese are Immigrants from El Salvador (19.6%, a difference of 0.010%), Guyanese (19.6%, a difference of 0.060%), Spanish American Indian (19.6%, a difference of 0.11%), Iroquois (19.6%, a difference of 0.15%), and Immigrants from Cabo Verde (19.7%, a difference of 0.27%).
| Demographics | Rating | Rank | Child Poverty Among Boys Under 16 |
| Shoshone | 0.2 /100 | #260 | Tragic 19.4% |
| Immigrants | Ghana | 0.2 /100 | #261 | Tragic 19.4% |
| Immigrants | Guyana | 0.1 /100 | #262 | Tragic 19.5% |
| Ottawa | 0.1 /100 | #263 | Tragic 19.5% |
| Iroquois | 0.1 /100 | #264 | Tragic 19.6% |
| Guyanese | 0.1 /100 | #265 | Tragic 19.6% |
| Immigrants | El Salvador | 0.1 /100 | #266 | Tragic 19.6% |
| Vietnamese | 0.1 /100 | #267 | Tragic 19.6% |
| Spanish American Indians | 0.1 /100 | #268 | Tragic 19.6% |
| Immigrants | Cabo Verde | 0.1 /100 | #269 | Tragic 19.7% |
| Cherokee | 0.1 /100 | #270 | Tragic 19.7% |
| Chickasaw | 0.1 /100 | #271 | Tragic 19.8% |
| Immigrants | Ecuador | 0.1 /100 | #272 | Tragic 19.8% |
| Belizeans | 0.1 /100 | #273 | Tragic 19.9% |
| Immigrants | Bangladesh | 0.0 /100 | #274 | Tragic 19.9% |
Demographics Similar to Immigrants from Northern Europe by Child Poverty Among Boys Under 16
In terms of child poverty among boys under 16, the demographic groups most similar to Immigrants from Northern Europe are Immigrants from Australia (13.9%, a difference of 0.14%), Immigrants from Sri Lanka (13.9%, a difference of 0.15%), Immigrants from Asia (13.9%, a difference of 0.38%), Lithuanian (14.0%, a difference of 0.47%), and Korean (14.0%, a difference of 0.49%).
| Demographics | Rating | Rank | Child Poverty Among Boys Under 16 |
| Turks | 99.8 /100 | #31 | Exceptional 13.6% |
| Immigrants | China | 99.8 /100 | #32 | Exceptional 13.6% |
| Danes | 99.8 /100 | #33 | Exceptional 13.6% |
| Assyrians/Chaldeans/Syriacs | 99.8 /100 | #34 | Exceptional 13.6% |
| Russians | 99.7 /100 | #35 | Exceptional 13.8% |
| Luxembourgers | 99.7 /100 | #36 | Exceptional 13.8% |
| Immigrants | Sri Lanka | 99.6 /100 | #37 | Exceptional 13.9% |
| Immigrants | Northern Europe | 99.6 /100 | #38 | Exceptional 13.9% |
| Immigrants | Australia | 99.6 /100 | #39 | Exceptional 13.9% |
| Immigrants | Asia | 99.6 /100 | #40 | Exceptional 13.9% |
| Lithuanians | 99.6 /100 | #41 | Exceptional 14.0% |
| Koreans | 99.6 /100 | #42 | Exceptional 14.0% |
| Croatians | 99.5 /100 | #43 | Exceptional 14.0% |
| Estonians | 99.4 /100 | #44 | Exceptional 14.1% |
| Immigrants | Scotland | 99.4 /100 | #45 | Exceptional 14.1% |