Vietnamese vs Salvadoran Child Poverty Among Boys Under 16
COMPARE
Vietnamese
Salvadoran
Child Poverty Among Boys Under 16
Child Poverty Among Boys Under 16 Comparison
Vietnamese
Salvadorans
19.6%
CHILD POVERTY AMONG BOYS UNDER 16
0.1/ 100
METRIC RATING
267th/ 347
METRIC RANK
19.0%
CHILD POVERTY AMONG BOYS UNDER 16
0.3/ 100
METRIC RATING
248th/ 347
METRIC RANK
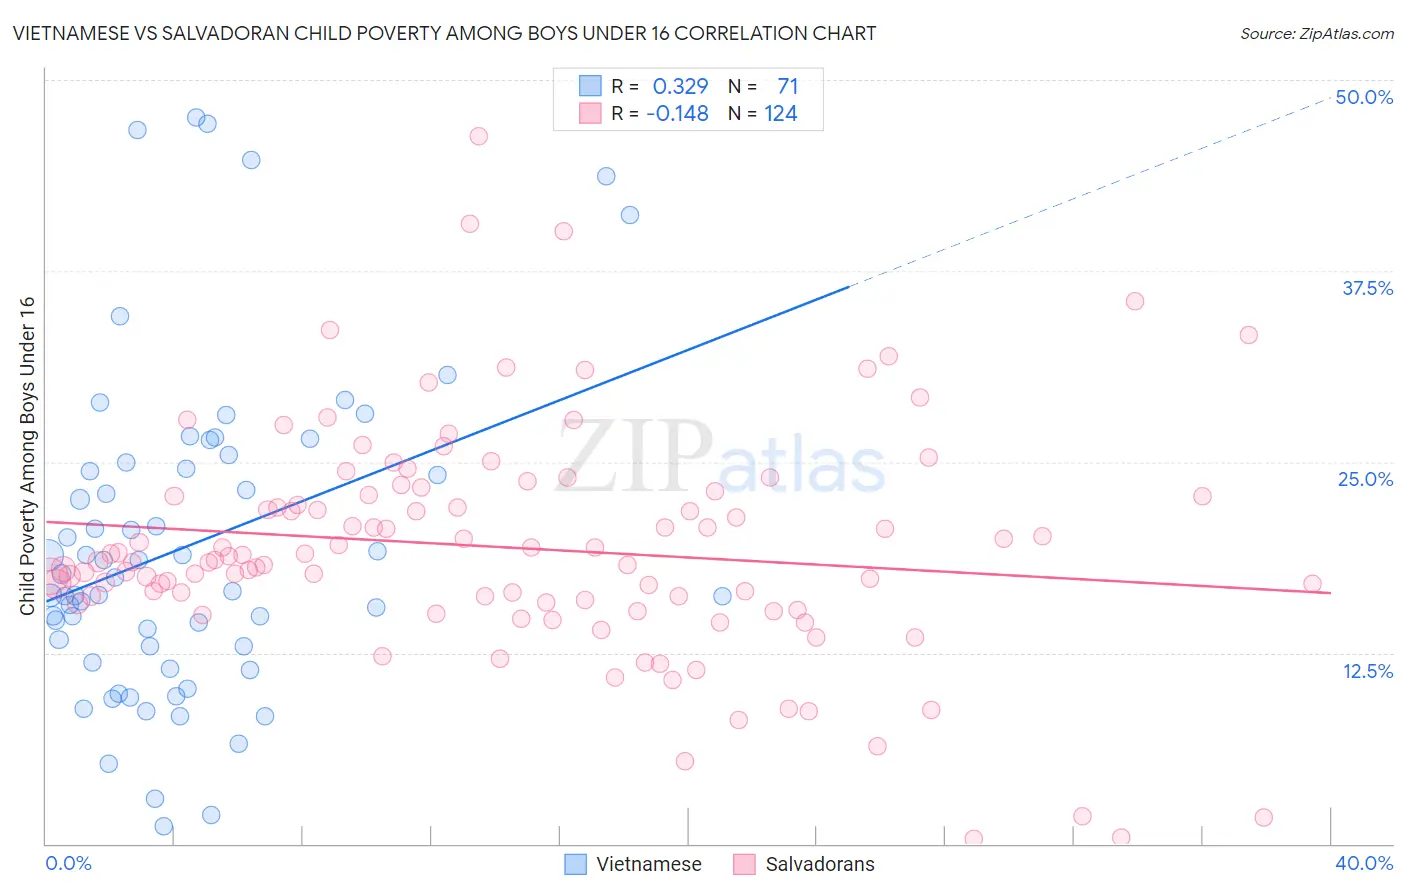
Vietnamese vs Salvadoran Child Poverty Among Boys Under 16 Correlation Chart
The statistical analysis conducted on geographies consisting of 169,843,059 people shows a mild positive correlation between the proportion of Vietnamese and poverty level among boys under the age of 16 in the United States with a correlation coefficient (R) of 0.329 and weighted average of 19.6%. Similarly, the statistical analysis conducted on geographies consisting of 394,231,551 people shows a poor negative correlation between the proportion of Salvadorans and poverty level among boys under the age of 16 in the United States with a correlation coefficient (R) of -0.148 and weighted average of 19.0%, a difference of 2.9%.
Child Poverty Among Boys Under 16 Correlation Summary
| Measurement | Vietnamese | Salvadoran |
| Minimum | 1.2% | 0.35% |
| Maximum | 47.5% | 46.3% |
| Range | 46.4% | 46.0% |
| Mean | 19.5% | 19.4% |
| Median | 17.5% | 18.5% |
| Interquartile 25% (IQ1) | 12.9% | 15.9% |
| Interquartile 75% (IQ3) | 25.0% | 22.8% |
| Interquartile Range (IQR) | 12.1% | 6.9% |
| Standard Deviation (Sample) | 10.6% | 7.5% |
| Standard Deviation (Population) | 10.5% | 7.5% |
Demographics Similar to Vietnamese and Salvadorans by Child Poverty Among Boys Under 16
In terms of child poverty among boys under 16, the demographic groups most similar to Vietnamese are Immigrants from El Salvador (19.6%, a difference of 0.010%), Guyanese (19.6%, a difference of 0.060%), Iroquois (19.6%, a difference of 0.15%), Ottawa (19.5%, a difference of 0.37%), and Immigrants from Guyana (19.5%, a difference of 0.68%). Similarly, the demographic groups most similar to Salvadorans are Immigrants from Trinidad and Tobago (19.0%, a difference of 0.080%), Alsatian (19.1%, a difference of 0.17%), Immigrants from Burma/Myanmar (19.2%, a difference of 0.87%), French American Indian (19.2%, a difference of 0.90%), and Immigrants from Western Africa (19.3%, a difference of 1.1%).
| Demographics | Rating | Rank | Child Poverty Among Boys Under 16 |
| Immigrants | Trinidad and Tobago | 0.3 /100 | #247 | Tragic 19.0% |
| Salvadorans | 0.3 /100 | #248 | Tragic 19.0% |
| Alsatians | 0.3 /100 | #249 | Tragic 19.1% |
| Immigrants | Burma/Myanmar | 0.2 /100 | #250 | Tragic 19.2% |
| French American Indians | 0.2 /100 | #251 | Tragic 19.2% |
| Immigrants | Western Africa | 0.2 /100 | #252 | Tragic 19.3% |
| Liberians | 0.2 /100 | #253 | Tragic 19.3% |
| Trinidadians and Tobagonians | 0.2 /100 | #254 | Tragic 19.3% |
| Ecuadorians | 0.2 /100 | #255 | Tragic 19.3% |
| Immigrants | Liberia | 0.2 /100 | #256 | Tragic 19.3% |
| Mexican American Indians | 0.2 /100 | #257 | Tragic 19.4% |
| Potawatomi | 0.2 /100 | #258 | Tragic 19.4% |
| Spanish Americans | 0.2 /100 | #259 | Tragic 19.4% |
| Shoshone | 0.2 /100 | #260 | Tragic 19.4% |
| Immigrants | Ghana | 0.2 /100 | #261 | Tragic 19.4% |
| Immigrants | Guyana | 0.1 /100 | #262 | Tragic 19.5% |
| Ottawa | 0.1 /100 | #263 | Tragic 19.5% |
| Iroquois | 0.1 /100 | #264 | Tragic 19.6% |
| Guyanese | 0.1 /100 | #265 | Tragic 19.6% |
| Immigrants | El Salvador | 0.1 /100 | #266 | Tragic 19.6% |
| Vietnamese | 0.1 /100 | #267 | Tragic 19.6% |