Italian vs Immigrants from Hungary Female Poverty
COMPARE
Italian
Immigrants from Hungary
Female Poverty
Female Poverty Comparison
Italians
Immigrants from Hungary
11.6%
FEMALE POVERTY
99.7/ 100
METRIC RATING
21st/ 347
METRIC RANK
12.7%
FEMALE POVERTY
90.3/ 100
METRIC RATING
121st/ 347
METRIC RANK
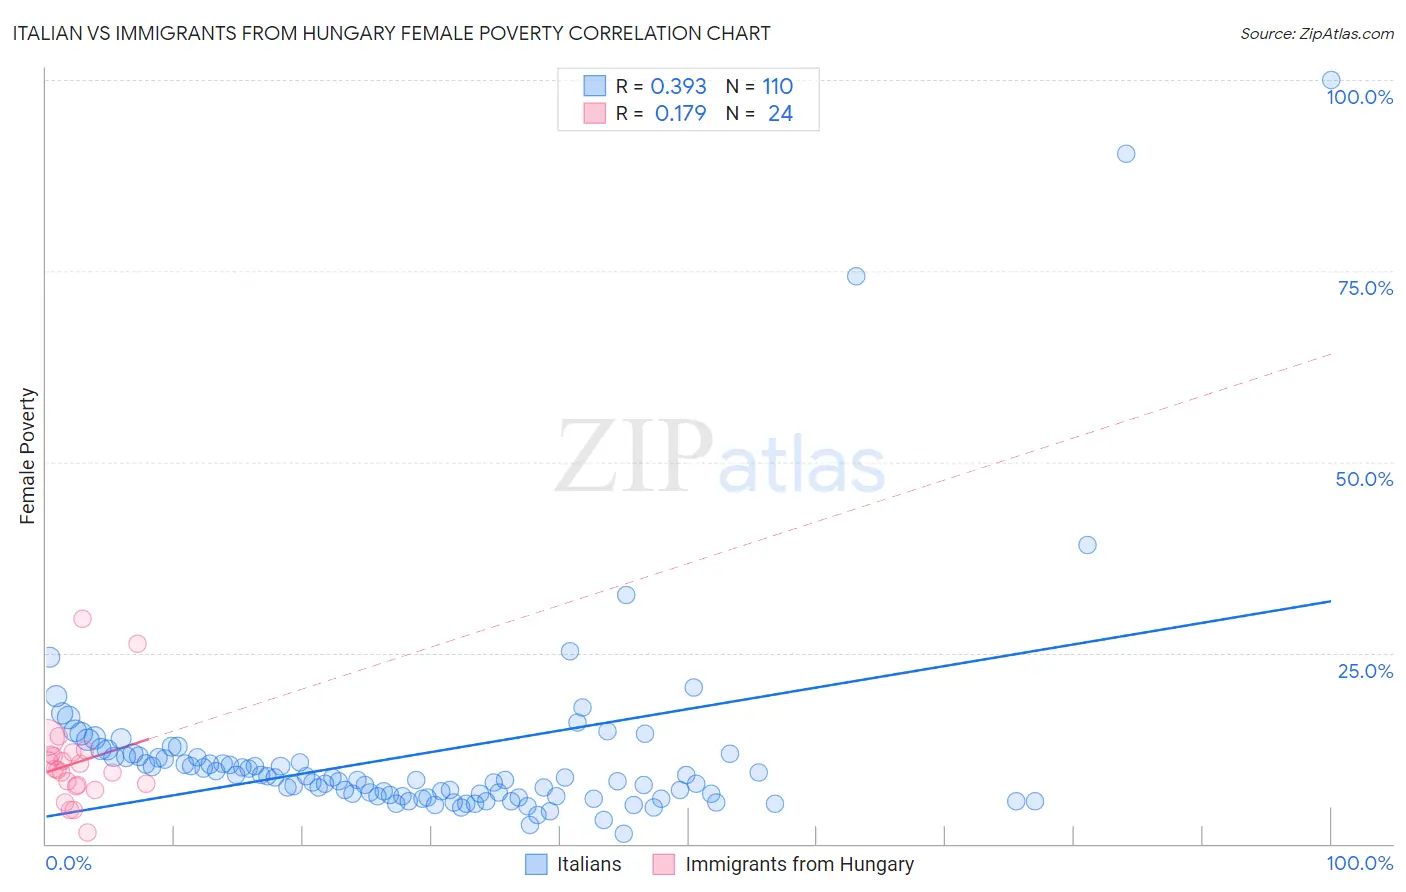
Italian vs Immigrants from Hungary Female Poverty Correlation Chart
The statistical analysis conducted on geographies consisting of 573,632,055 people shows a mild positive correlation between the proportion of Italians and poverty level among females in the United States with a correlation coefficient (R) of 0.393 and weighted average of 11.6%. Similarly, the statistical analysis conducted on geographies consisting of 195,645,999 people shows a poor positive correlation between the proportion of Immigrants from Hungary and poverty level among females in the United States with a correlation coefficient (R) of 0.179 and weighted average of 12.7%, a difference of 9.8%.
Female Poverty Correlation Summary
| Measurement | Italian | Immigrants from Hungary |
| Minimum | 1.3% | 1.5% |
| Maximum | 100.0% | 29.4% |
| Range | 98.7% | 27.9% |
| Mean | 11.8% | 10.6% |
| Median | 8.5% | 9.8% |
| Interquartile 25% (IQ1) | 6.3% | 7.6% |
| Interquartile 75% (IQ3) | 11.4% | 11.8% |
| Interquartile Range (IQR) | 5.1% | 4.2% |
| Standard Deviation (Sample) | 14.1% | 6.1% |
| Standard Deviation (Population) | 14.0% | 6.0% |
Similar Demographics by Female Poverty
Demographics Similar to Italians by Female Poverty
In terms of female poverty, the demographic groups most similar to Italians are Swedish (11.6%, a difference of 0.030%), Burmese (11.6%, a difference of 0.17%), Luxembourger (11.6%, a difference of 0.19%), Immigrants from Northern Europe (11.6%, a difference of 0.45%), and Croatian (11.6%, a difference of 0.46%).
| Demographics | Rating | Rank | Female Poverty |
| Lithuanians | 99.8 /100 | #14 | Exceptional 11.4% |
| Latvians | 99.8 /100 | #15 | Exceptional 11.4% |
| Immigrants | Bolivia | 99.8 /100 | #16 | Exceptional 11.5% |
| Bolivians | 99.8 /100 | #17 | Exceptional 11.5% |
| Immigrants | Scotland | 99.8 /100 | #18 | Exceptional 11.5% |
| Norwegians | 99.8 /100 | #19 | Exceptional 11.5% |
| Eastern Europeans | 99.7 /100 | #20 | Exceptional 11.5% |
| Italians | 99.7 /100 | #21 | Exceptional 11.6% |
| Swedes | 99.7 /100 | #22 | Exceptional 11.6% |
| Burmese | 99.7 /100 | #23 | Exceptional 11.6% |
| Luxembourgers | 99.7 /100 | #24 | Exceptional 11.6% |
| Immigrants | Northern Europe | 99.6 /100 | #25 | Exceptional 11.6% |
| Croatians | 99.6 /100 | #26 | Exceptional 11.6% |
| Iranians | 99.6 /100 | #27 | Exceptional 11.7% |
| Immigrants | Korea | 99.6 /100 | #28 | Exceptional 11.7% |
Demographics Similar to Immigrants from Hungary by Female Poverty
In terms of female poverty, the demographic groups most similar to Immigrants from Hungary are French Canadian (12.7%, a difference of 0.040%), New Zealander (12.7%, a difference of 0.10%), Immigrants from South Eastern Asia (12.7%, a difference of 0.10%), Albanian (12.7%, a difference of 0.16%), and Sri Lankan (12.7%, a difference of 0.17%).
| Demographics | Rating | Rank | Female Poverty |
| Welsh | 91.6 /100 | #114 | Exceptional 12.7% |
| Puget Sound Salish | 91.5 /100 | #115 | Exceptional 12.7% |
| Immigrants | Russia | 91.2 /100 | #116 | Exceptional 12.7% |
| Immigrants | Southern Europe | 90.9 /100 | #117 | Exceptional 12.7% |
| Sri Lankans | 90.9 /100 | #118 | Exceptional 12.7% |
| Albanians | 90.8 /100 | #119 | Exceptional 12.7% |
| New Zealanders | 90.6 /100 | #120 | Exceptional 12.7% |
| Immigrants | Hungary | 90.3 /100 | #121 | Exceptional 12.7% |
| French Canadians | 90.2 /100 | #122 | Exceptional 12.7% |
| Immigrants | South Eastern Asia | 89.9 /100 | #123 | Excellent 12.7% |
| Immigrants | Norway | 89.3 /100 | #124 | Excellent 12.8% |
| Argentineans | 89.1 /100 | #125 | Excellent 12.8% |
| Immigrants | Ukraine | 88.8 /100 | #126 | Excellent 12.8% |
| South Africans | 88.4 /100 | #127 | Excellent 12.8% |
| Immigrants | Belarus | 88.2 /100 | #128 | Excellent 12.8% |