Vietnamese vs Immigrants from Congo Female Poverty Among 25-34 Year Olds
COMPARE
Vietnamese
Immigrants from Congo
Female Poverty Among 25-34 Year Olds
Female Poverty Among 25-34 Year Olds Comparison
Vietnamese
Immigrants from Congo
14.6%
FEMALE POVERTY AMONG 25-34 YEAR OLDS
2.6/ 100
METRIC RATING
228th/ 347
METRIC RANK
16.7%
FEMALE POVERTY AMONG 25-34 YEAR OLDS
0.0/ 100
METRIC RATING
301st/ 347
METRIC RANK
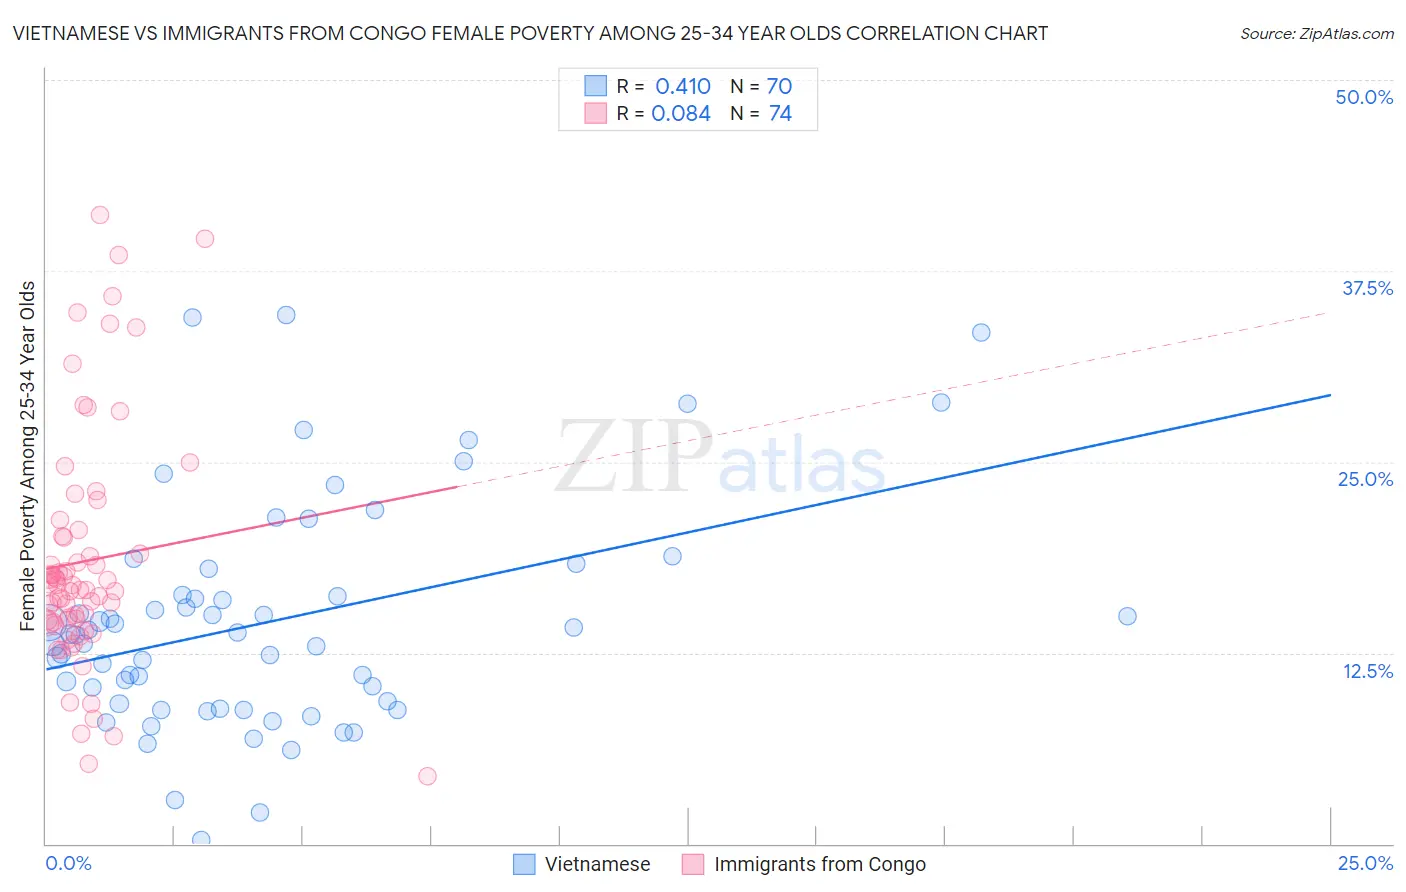
Vietnamese vs Immigrants from Congo Female Poverty Among 25-34 Year Olds Correlation Chart
The statistical analysis conducted on geographies consisting of 169,660,350 people shows a moderate positive correlation between the proportion of Vietnamese and poverty level among females between the ages 25 and 34 in the United States with a correlation coefficient (R) of 0.410 and weighted average of 14.6%. Similarly, the statistical analysis conducted on geographies consisting of 91,915,902 people shows a slight positive correlation between the proportion of Immigrants from Congo and poverty level among females between the ages 25 and 34 in the United States with a correlation coefficient (R) of 0.084 and weighted average of 16.7%, a difference of 15.1%.
Female Poverty Among 25-34 Year Olds Correlation Summary
| Measurement | Vietnamese | Immigrants from Congo |
| Minimum | 0.24% | 4.4% |
| Maximum | 34.6% | 41.2% |
| Range | 34.4% | 36.8% |
| Mean | 14.5% | 18.5% |
| Median | 13.7% | 16.8% |
| Interquartile 25% (IQ1) | 9.2% | 14.5% |
| Interquartile 75% (IQ3) | 16.3% | 20.1% |
| Interquartile Range (IQR) | 7.1% | 5.7% |
| Standard Deviation (Sample) | 7.3% | 7.8% |
| Standard Deviation (Population) | 7.3% | 7.7% |
Similar Demographics by Female Poverty Among 25-34 Year Olds
Demographics Similar to Vietnamese by Female Poverty Among 25-34 Year Olds
In terms of female poverty among 25-34 year olds, the demographic groups most similar to Vietnamese are Spanish (14.6%, a difference of 0.10%), Celtic (14.5%, a difference of 0.17%), Spaniard (14.6%, a difference of 0.23%), Delaware (14.6%, a difference of 0.27%), and Nicaraguan (14.5%, a difference of 0.47%).
| Demographics | Rating | Rank | Female Poverty Among 25-34 Year Olds |
| Sudanese | 4.4 /100 | #221 | Tragic 14.4% |
| Immigrants | Portugal | 4.3 /100 | #222 | Tragic 14.4% |
| Nigerians | 4.2 /100 | #223 | Tragic 14.4% |
| Immigrants | Sudan | 4.0 /100 | #224 | Tragic 14.4% |
| Immigrants | Barbados | 3.4 /100 | #225 | Tragic 14.5% |
| Nicaraguans | 3.3 /100 | #226 | Tragic 14.5% |
| Celtics | 2.8 /100 | #227 | Tragic 14.5% |
| Vietnamese | 2.6 /100 | #228 | Tragic 14.6% |
| Spanish | 2.5 /100 | #229 | Tragic 14.6% |
| Spaniards | 2.3 /100 | #230 | Tragic 14.6% |
| Delaware | 2.3 /100 | #231 | Tragic 14.6% |
| Immigrants | Ecuador | 1.9 /100 | #232 | Tragic 14.6% |
| Whites/Caucasians | 1.8 /100 | #233 | Tragic 14.7% |
| Cubans | 1.6 /100 | #234 | Tragic 14.7% |
| Immigrants | Jamaica | 1.4 /100 | #235 | Tragic 14.7% |
Demographics Similar to Immigrants from Congo by Female Poverty Among 25-34 Year Olds
In terms of female poverty among 25-34 year olds, the demographic groups most similar to Immigrants from Congo are U.S. Virgin Islander (16.7%, a difference of 0.010%), Alaska Native (16.8%, a difference of 0.11%), Spanish American (16.7%, a difference of 0.16%), Blackfeet (16.7%, a difference of 0.20%), and Immigrants from Mexico (16.8%, a difference of 0.43%).
| Demographics | Rating | Rank | Female Poverty Among 25-34 Year Olds |
| Immigrants | Central America | 0.0 /100 | #294 | Tragic 16.6% |
| Mexicans | 0.0 /100 | #295 | Tragic 16.6% |
| Hispanics or Latinos | 0.0 /100 | #296 | Tragic 16.6% |
| Immigrants | Guatemala | 0.0 /100 | #297 | Tragic 16.6% |
| Blackfeet | 0.0 /100 | #298 | Tragic 16.7% |
| Spanish Americans | 0.0 /100 | #299 | Tragic 16.7% |
| U.S. Virgin Islanders | 0.0 /100 | #300 | Tragic 16.7% |
| Immigrants | Congo | 0.0 /100 | #301 | Tragic 16.7% |
| Alaska Natives | 0.0 /100 | #302 | Tragic 16.8% |
| Immigrants | Mexico | 0.0 /100 | #303 | Tragic 16.8% |
| Hondurans | 0.0 /100 | #304 | Tragic 16.9% |
| Immigrants | Cabo Verde | 0.0 /100 | #305 | Tragic 16.9% |
| Chickasaw | 0.0 /100 | #306 | Tragic 17.0% |
| Yaqui | 0.0 /100 | #307 | Tragic 17.0% |
| Africans | 0.0 /100 | #308 | Tragic 17.0% |