Venezuelan vs Immigrants from Kazakhstan Child Poverty Under the Age of 5
COMPARE
Venezuelan
Immigrants from Kazakhstan
Child Poverty Under the Age of 5
Child Poverty Under the Age of 5 Comparison
Venezuelans
Immigrants from Kazakhstan
16.8%
CHILD POVERTY UNDER THE AGE OF 5
73.7/ 100
METRIC RATING
157th/ 347
METRIC RANK
15.8%
CHILD POVERTY UNDER THE AGE OF 5
96.2/ 100
METRIC RATING
96th/ 347
METRIC RANK
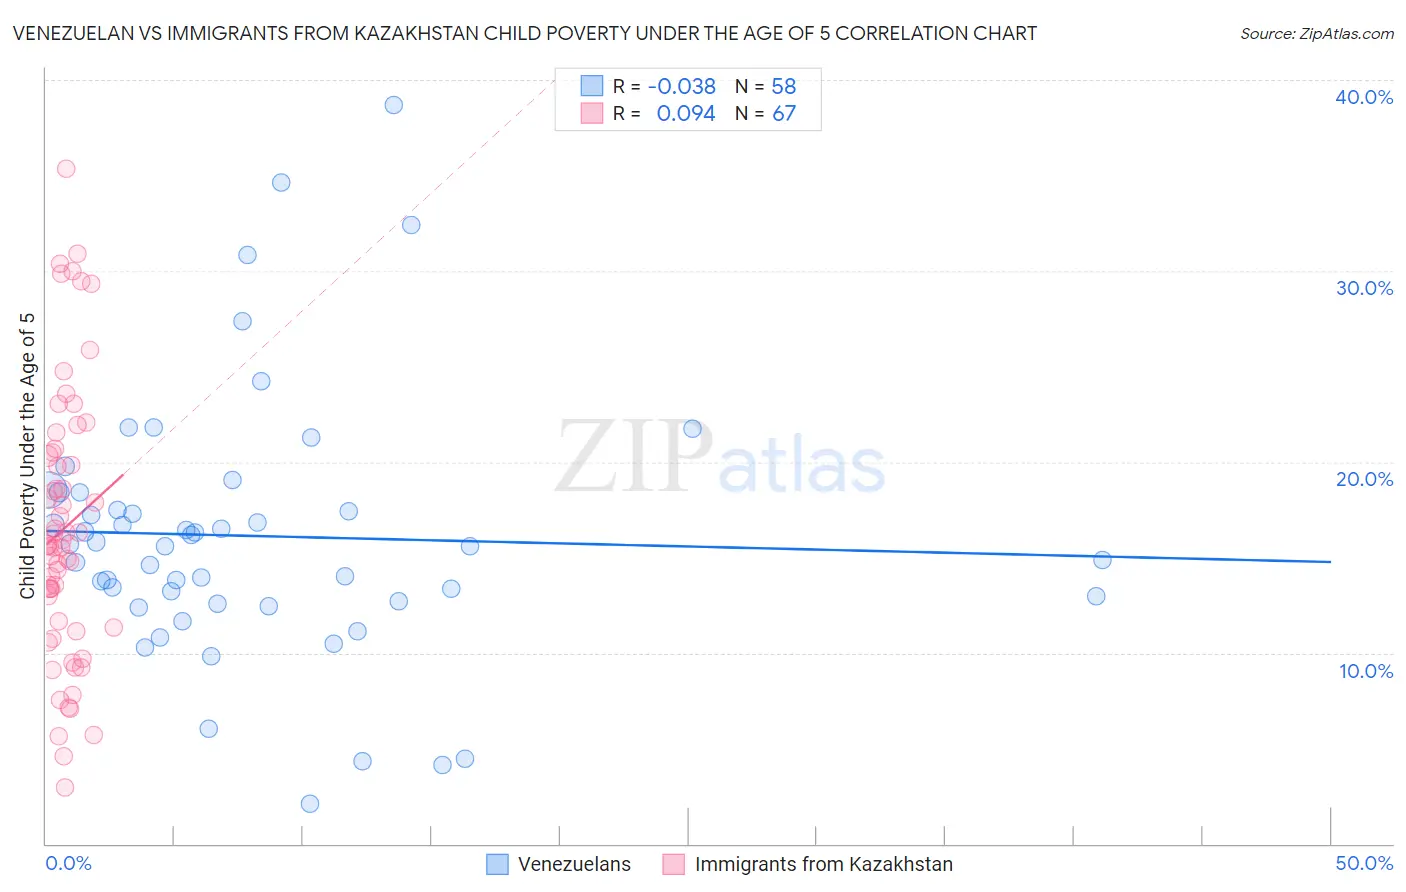
Venezuelan vs Immigrants from Kazakhstan Child Poverty Under the Age of 5 Correlation Chart
The statistical analysis conducted on geographies consisting of 297,331,987 people shows no correlation between the proportion of Venezuelans and poverty level among children under the age of 5 in the United States with a correlation coefficient (R) of -0.038 and weighted average of 16.8%. Similarly, the statistical analysis conducted on geographies consisting of 121,784,551 people shows a slight positive correlation between the proportion of Immigrants from Kazakhstan and poverty level among children under the age of 5 in the United States with a correlation coefficient (R) of 0.094 and weighted average of 15.8%, a difference of 6.2%.
Child Poverty Under the Age of 5 Correlation Summary
| Measurement | Venezuelan | Immigrants from Kazakhstan |
| Minimum | 2.1% | 2.9% |
| Maximum | 38.7% | 35.4% |
| Range | 36.6% | 32.4% |
| Mean | 16.1% | 16.5% |
| Median | 15.7% | 15.6% |
| Interquartile 25% (IQ1) | 12.7% | 11.3% |
| Interquartile 75% (IQ3) | 18.4% | 20.5% |
| Interquartile Range (IQR) | 5.7% | 9.2% |
| Standard Deviation (Sample) | 6.9% | 7.1% |
| Standard Deviation (Population) | 6.8% | 7.0% |
Similar Demographics by Child Poverty Under the Age of 5
Demographics Similar to Venezuelans by Child Poverty Under the Age of 5
In terms of child poverty under the age of 5, the demographic groups most similar to Venezuelans are Afghan (16.8%, a difference of 0.090%), Czechoslovakian (16.8%, a difference of 0.16%), South American (16.7%, a difference of 0.19%), Immigrants from Syria (16.8%, a difference of 0.20%), and Irish (16.8%, a difference of 0.23%).
| Demographics | Rating | Rank | Child Poverty Under the Age of 5 |
| Colombians | 77.8 /100 | #150 | Good 16.7% |
| Canadians | 77.6 /100 | #151 | Good 16.7% |
| Belgians | 77.2 /100 | #152 | Good 16.7% |
| Dutch | 77.1 /100 | #153 | Good 16.7% |
| Immigrants | Venezuela | 76.0 /100 | #154 | Good 16.7% |
| South Americans | 75.1 /100 | #155 | Good 16.7% |
| Afghans | 74.4 /100 | #156 | Good 16.8% |
| Venezuelans | 73.7 /100 | #157 | Good 16.8% |
| Czechoslovakians | 72.5 /100 | #158 | Good 16.8% |
| Immigrants | Syria | 72.3 /100 | #159 | Good 16.8% |
| Irish | 72.0 /100 | #160 | Good 16.8% |
| English | 70.4 /100 | #161 | Good 16.8% |
| Costa Ricans | 69.8 /100 | #162 | Good 16.9% |
| Scottish | 68.6 /100 | #163 | Good 16.9% |
| Immigrants | Oceania | 67.6 /100 | #164 | Good 16.9% |
Demographics Similar to Immigrants from Kazakhstan by Child Poverty Under the Age of 5
In terms of child poverty under the age of 5, the demographic groups most similar to Immigrants from Kazakhstan are Macedonian (15.8%, a difference of 0.040%), Immigrants from South Africa (15.8%, a difference of 0.11%), Immigrants from Switzerland (15.8%, a difference of 0.13%), Palestinian (15.8%, a difference of 0.22%), and Immigrants from Canada (15.8%, a difference of 0.24%).
| Demographics | Rating | Rank | Child Poverty Under the Age of 5 |
| Immigrants | Croatia | 97.3 /100 | #89 | Exceptional 15.6% |
| Immigrants | France | 97.3 /100 | #90 | Exceptional 15.6% |
| Poles | 97.2 /100 | #91 | Exceptional 15.7% |
| Scandinavians | 97.1 /100 | #92 | Exceptional 15.7% |
| Ukrainians | 97.1 /100 | #93 | Exceptional 15.7% |
| Immigrants | South Eastern Asia | 97.1 /100 | #94 | Exceptional 15.7% |
| Immigrants | Switzerland | 96.4 /100 | #95 | Exceptional 15.8% |
| Immigrants | Kazakhstan | 96.2 /100 | #96 | Exceptional 15.8% |
| Macedonians | 96.2 /100 | #97 | Exceptional 15.8% |
| Immigrants | South Africa | 96.1 /100 | #98 | Exceptional 15.8% |
| Palestinians | 95.9 /100 | #99 | Exceptional 15.8% |
| Immigrants | Canada | 95.9 /100 | #100 | Exceptional 15.8% |
| Immigrants | Zimbabwe | 95.9 /100 | #101 | Exceptional 15.8% |
| Armenians | 95.7 /100 | #102 | Exceptional 15.8% |
| Europeans | 95.3 /100 | #103 | Exceptional 15.9% |