U.S. Virgin Islander vs Immigrants from South Eastern Asia Poverty
COMPARE
U.S. Virgin Islander
Immigrants from South Eastern Asia
Poverty
Poverty Comparison
U.S. Virgin Islanders
Immigrants from South Eastern Asia
16.1%
POVERTY
0.0/ 100
METRIC RATING
317th/ 347
METRIC RANK
11.7%
POVERTY
88.9/ 100
METRIC RATING
120th/ 347
METRIC RANK
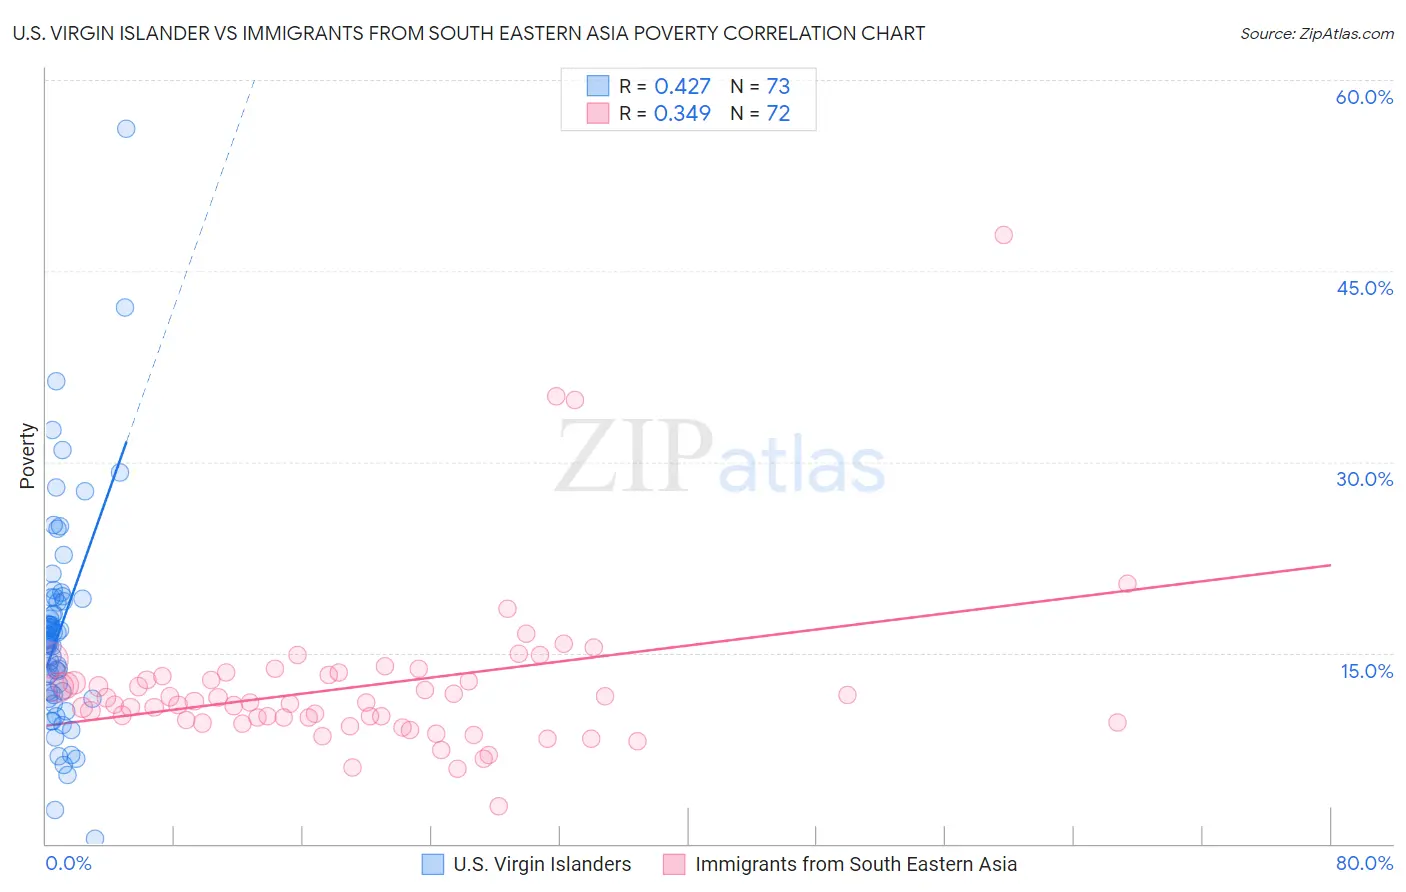
U.S. Virgin Islander vs Immigrants from South Eastern Asia Poverty Correlation Chart
The statistical analysis conducted on geographies consisting of 87,513,467 people shows a moderate positive correlation between the proportion of U.S. Virgin Islanders and poverty level in the United States with a correlation coefficient (R) of 0.427 and weighted average of 16.1%. Similarly, the statistical analysis conducted on geographies consisting of 512,258,667 people shows a mild positive correlation between the proportion of Immigrants from South Eastern Asia and poverty level in the United States with a correlation coefficient (R) of 0.349 and weighted average of 11.7%, a difference of 37.3%.
Poverty Correlation Summary
| Measurement | U.S. Virgin Islander | Immigrants from South Eastern Asia |
| Minimum | 0.43% | 3.0% |
| Maximum | 56.2% | 47.9% |
| Range | 55.8% | 44.9% |
| Mean | 16.8% | 12.4% |
| Median | 16.0% | 11.1% |
| Interquartile 25% (IQ1) | 11.8% | 9.6% |
| Interquartile 75% (IQ3) | 19.3% | 13.2% |
| Interquartile Range (IQR) | 7.5% | 3.6% |
| Standard Deviation (Sample) | 8.7% | 6.4% |
| Standard Deviation (Population) | 8.6% | 6.4% |
Similar Demographics by Poverty
Demographics Similar to U.S. Virgin Islanders by Poverty
In terms of poverty, the demographic groups most similar to U.S. Virgin Islanders are Immigrants from Dominica (16.1%, a difference of 0.29%), Immigrants from Congo (16.1%, a difference of 0.49%), Immigrants from Honduras (16.2%, a difference of 0.72%), British West Indian (15.9%, a difference of 1.3%), and Honduran (15.9%, a difference of 1.3%).
| Demographics | Rating | Rank | Poverty |
| Dutch West Indians | 0.0 /100 | #310 | Tragic 15.6% |
| Chippewa | 0.0 /100 | #311 | Tragic 15.7% |
| Cajuns | 0.0 /100 | #312 | Tragic 15.7% |
| Immigrants | Grenada | 0.0 /100 | #313 | Tragic 15.8% |
| Immigrants | Somalia | 0.0 /100 | #314 | Tragic 15.8% |
| British West Indians | 0.0 /100 | #315 | Tragic 15.9% |
| Hondurans | 0.0 /100 | #316 | Tragic 15.9% |
| U.S. Virgin Islanders | 0.0 /100 | #317 | Tragic 16.1% |
| Immigrants | Dominica | 0.0 /100 | #318 | Tragic 16.1% |
| Immigrants | Congo | 0.0 /100 | #319 | Tragic 16.1% |
| Immigrants | Honduras | 0.0 /100 | #320 | Tragic 16.2% |
| Arapaho | 0.0 /100 | #321 | Tragic 16.3% |
| Menominee | 0.0 /100 | #322 | Tragic 16.4% |
| Colville | 0.0 /100 | #323 | Tragic 16.6% |
| Yakama | 0.0 /100 | #324 | Tragic 16.7% |
Demographics Similar to Immigrants from South Eastern Asia by Poverty
In terms of poverty, the demographic groups most similar to Immigrants from South Eastern Asia are Tlingit-Haida (11.7%, a difference of 0.010%), Argentinean (11.7%, a difference of 0.050%), New Zealander (11.7%, a difference of 0.060%), Puget Sound Salish (11.7%, a difference of 0.060%), and Immigrants from Hungary (11.7%, a difference of 0.080%).
| Demographics | Rating | Rank | Poverty |
| Immigrants | Belarus | 90.8 /100 | #113 | Exceptional 11.6% |
| Immigrants | China | 90.7 /100 | #114 | Exceptional 11.6% |
| Albanians | 90.3 /100 | #115 | Exceptional 11.7% |
| Immigrants | Russia | 89.7 /100 | #116 | Excellent 11.7% |
| Sri Lankans | 89.4 /100 | #117 | Excellent 11.7% |
| Argentineans | 89.1 /100 | #118 | Excellent 11.7% |
| Tlingit-Haida | 89.0 /100 | #119 | Excellent 11.7% |
| Immigrants | South Eastern Asia | 88.9 /100 | #120 | Excellent 11.7% |
| New Zealanders | 88.7 /100 | #121 | Excellent 11.7% |
| Puget Sound Salish | 88.7 /100 | #122 | Excellent 11.7% |
| Immigrants | Hungary | 88.6 /100 | #123 | Excellent 11.7% |
| Soviet Union | 88.4 /100 | #124 | Excellent 11.7% |
| Immigrants | Brazil | 88.2 /100 | #125 | Excellent 11.7% |
| Immigrants | Norway | 88.0 /100 | #126 | Excellent 11.7% |
| Immigrants | Argentina | 88.0 /100 | #127 | Excellent 11.7% |