German Russian vs Immigrants from Costa Rica Child Poverty Among Boys Under 16
COMPARE
German Russian
Immigrants from Costa Rica
Child Poverty Among Boys Under 16
Child Poverty Among Boys Under 16 Comparison
German Russians
Immigrants from Costa Rica
17.4%
CHILD POVERTY AMONG BOYS UNDER 16
10.9/ 100
METRIC RATING
206th/ 347
METRIC RANK
16.7%
CHILD POVERTY AMONG BOYS UNDER 16
37.8/ 100
METRIC RATING
187th/ 347
METRIC RANK
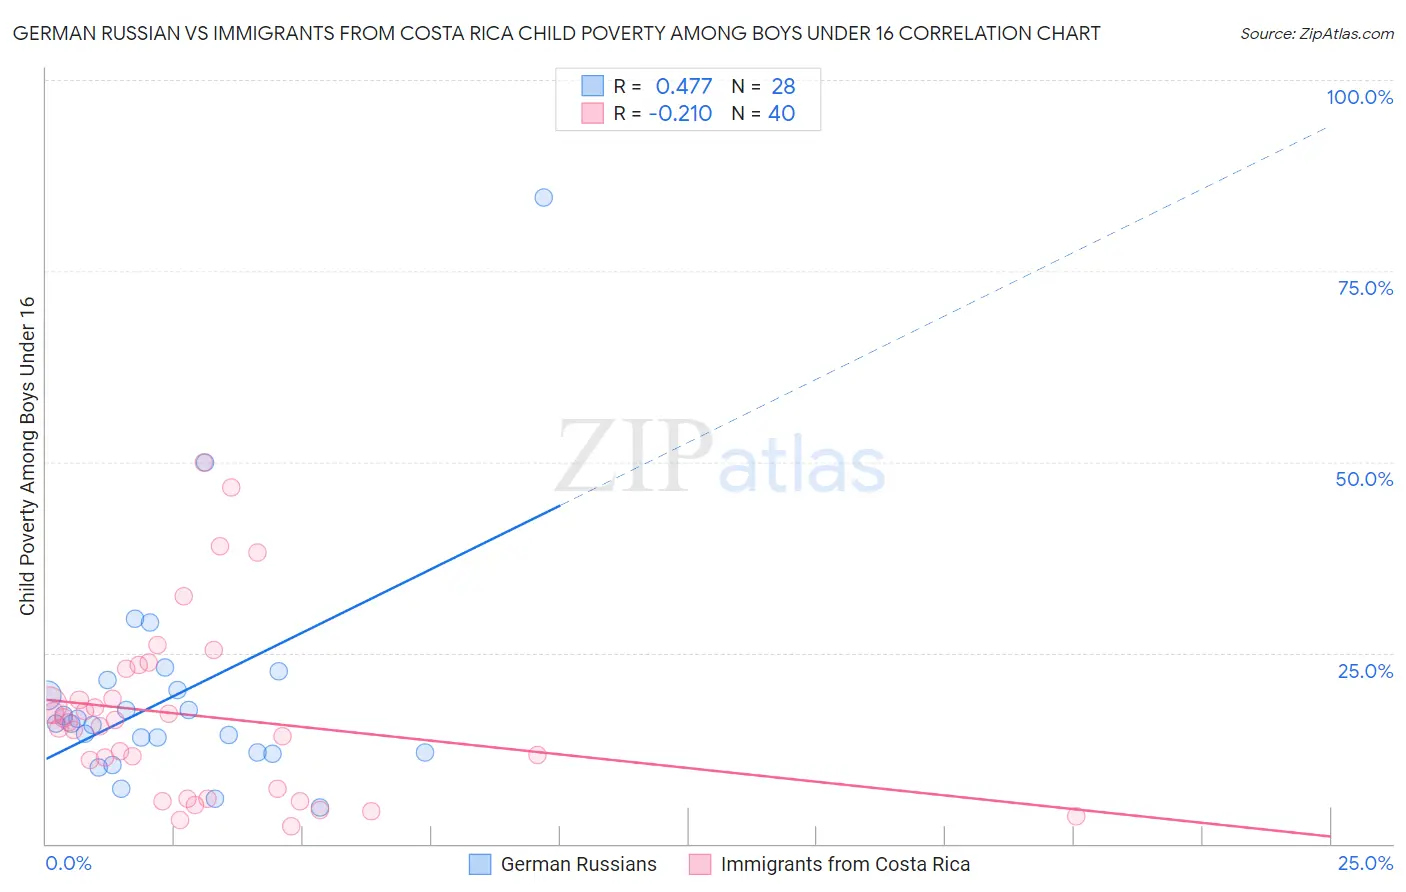
German Russian vs Immigrants from Costa Rica Child Poverty Among Boys Under 16 Correlation Chart
The statistical analysis conducted on geographies consisting of 95,990,905 people shows a moderate positive correlation between the proportion of German Russians and poverty level among boys under the age of 16 in the United States with a correlation coefficient (R) of 0.477 and weighted average of 17.4%. Similarly, the statistical analysis conducted on geographies consisting of 202,823,387 people shows a weak negative correlation between the proportion of Immigrants from Costa Rica and poverty level among boys under the age of 16 in the United States with a correlation coefficient (R) of -0.210 and weighted average of 16.7%, a difference of 4.4%.
Child Poverty Among Boys Under 16 Correlation Summary
| Measurement | German Russian | Immigrants from Costa Rica |
| Minimum | 4.7% | 2.3% |
| Maximum | 84.6% | 50.0% |
| Range | 79.9% | 47.7% |
| Mean | 19.5% | 16.8% |
| Median | 15.7% | 15.7% |
| Interquartile 25% (IQ1) | 12.0% | 6.6% |
| Interquartile 75% (IQ3) | 20.8% | 20.9% |
| Interquartile Range (IQR) | 8.8% | 14.3% |
| Standard Deviation (Sample) | 15.5% | 11.6% |
| Standard Deviation (Population) | 15.2% | 11.4% |
Demographics Similar to German Russians and Immigrants from Costa Rica by Child Poverty Among Boys Under 16
In terms of child poverty among boys under 16, the demographic groups most similar to German Russians are Immigrants from Portugal (17.4%, a difference of 0.060%), Ugandan (17.3%, a difference of 0.39%), Immigrants from Uzbekistan (17.3%, a difference of 0.59%), Immigrants from Sierra Leone (17.3%, a difference of 0.61%), and Immigrants from Afghanistan (17.3%, a difference of 0.68%). Similarly, the demographic groups most similar to Immigrants from Costa Rica are Immigrants from South America (16.7%, a difference of 0.010%), Hmong (16.6%, a difference of 0.080%), Immigrants from Morocco (16.7%, a difference of 0.39%), Arab (16.8%, a difference of 0.82%), and Alaska Native (16.8%, a difference of 0.99%).
| Demographics | Rating | Rank | Child Poverty Among Boys Under 16 |
| Hmong | 38.4 /100 | #186 | Fair 16.6% |
| Immigrants | Costa Rica | 37.8 /100 | #187 | Fair 16.7% |
| Immigrants | South America | 37.7 /100 | #188 | Fair 16.7% |
| Immigrants | Morocco | 34.5 /100 | #189 | Fair 16.7% |
| Arabs | 31.1 /100 | #190 | Fair 16.8% |
| Alaska Natives | 29.8 /100 | #191 | Fair 16.8% |
| Immigrants | Uganda | 21.6 /100 | #192 | Fair 17.0% |
| Immigrants | Iraq | 21.6 /100 | #193 | Fair 17.0% |
| Immigrants | Lebanon | 21.2 /100 | #194 | Fair 17.0% |
| Spanish | 20.8 /100 | #195 | Fair 17.0% |
| Spaniards | 20.5 /100 | #196 | Fair 17.1% |
| Immigrants | Kenya | 20.1 /100 | #197 | Fair 17.1% |
| Immigrants | Cameroon | 19.0 /100 | #198 | Poor 17.1% |
| Delaware | 18.8 /100 | #199 | Poor 17.1% |
| Immigrants | Uruguay | 16.9 /100 | #200 | Poor 17.2% |
| Immigrants | Afghanistan | 13.7 /100 | #201 | Poor 17.3% |
| Immigrants | Sierra Leone | 13.4 /100 | #202 | Poor 17.3% |
| Immigrants | Uzbekistan | 13.3 /100 | #203 | Poor 17.3% |
| Ugandans | 12.5 /100 | #204 | Poor 17.3% |
| Immigrants | Portugal | 11.2 /100 | #205 | Poor 17.4% |
| German Russians | 10.9 /100 | #206 | Poor 17.4% |