Ugandan vs Laotian Child Poverty Under the Age of 16
COMPARE
Ugandan
Laotian
Child Poverty Under the Age of 16
Child Poverty Under the Age of 16 Comparison
Ugandans
Laotians
17.1%
CHILD POVERTY UNDER THE AGE OF 16
14.3/ 100
METRIC RATING
202nd/ 347
METRIC RANK
14.3%
CHILD POVERTY UNDER THE AGE OF 16
98.0/ 100
METRIC RATING
68th/ 347
METRIC RANK
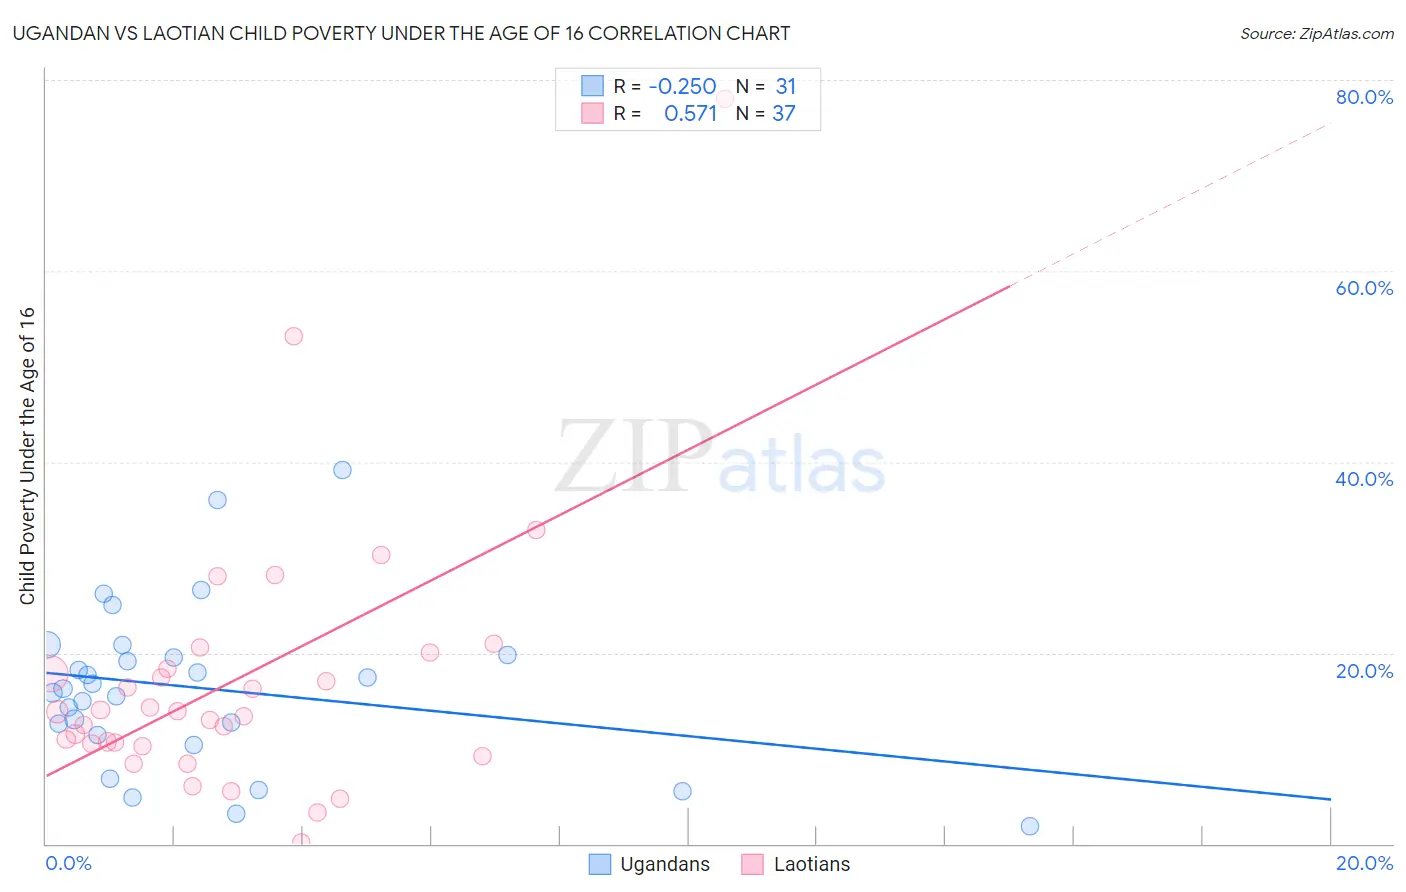
Ugandan vs Laotian Child Poverty Under the Age of 16 Correlation Chart
The statistical analysis conducted on geographies consisting of 93,855,381 people shows a weak negative correlation between the proportion of Ugandans and poverty level among children under the age of 16 in the United States with a correlation coefficient (R) of -0.250 and weighted average of 17.1%. Similarly, the statistical analysis conducted on geographies consisting of 223,849,875 people shows a substantial positive correlation between the proportion of Laotians and poverty level among children under the age of 16 in the United States with a correlation coefficient (R) of 0.571 and weighted average of 14.3%, a difference of 19.3%.
Child Poverty Under the Age of 16 Correlation Summary
| Measurement | Ugandan | Laotian |
| Minimum | 1.8% | 0.17% |
| Maximum | 39.2% | 78.1% |
| Range | 37.4% | 77.9% |
| Mean | 16.3% | 17.1% |
| Median | 16.3% | 13.8% |
| Interquartile 25% (IQ1) | 11.4% | 10.4% |
| Interquartile 75% (IQ3) | 19.7% | 19.1% |
| Interquartile Range (IQR) | 8.3% | 8.8% |
| Standard Deviation (Sample) | 8.6% | 14.1% |
| Standard Deviation (Population) | 8.4% | 13.9% |
Similar Demographics by Child Poverty Under the Age of 16
Demographics Similar to Ugandans by Child Poverty Under the Age of 16
In terms of child poverty under the age of 16, the demographic groups most similar to Ugandans are Immigrants from Sierra Leone (17.1%, a difference of 0.020%), Immigrants from Uzbekistan (17.1%, a difference of 0.080%), Hmong (17.1%, a difference of 0.080%), Immigrants from Cameroon (17.1%, a difference of 0.090%), and Aleut (17.1%, a difference of 0.090%).
| Demographics | Rating | Rank | Child Poverty Under the Age of 16 |
| Immigrants | Uganda | 22.5 /100 | #195 | Fair 16.8% |
| Immigrants | Lebanon | 22.0 /100 | #196 | Fair 16.8% |
| Immigrants | Kenya | 19.1 /100 | #197 | Poor 16.9% |
| Delaware | 17.1 /100 | #198 | Poor 17.0% |
| Immigrants | Afghanistan | 15.1 /100 | #199 | Poor 17.0% |
| Immigrants | Cameroon | 14.7 /100 | #200 | Poor 17.1% |
| Immigrants | Uzbekistan | 14.7 /100 | #201 | Poor 17.1% |
| Ugandans | 14.3 /100 | #202 | Poor 17.1% |
| Immigrants | Sierra Leone | 14.2 /100 | #203 | Poor 17.1% |
| Hmong | 14.0 /100 | #204 | Poor 17.1% |
| Aleuts | 13.9 /100 | #205 | Poor 17.1% |
| Alaska Natives | 11.8 /100 | #206 | Poor 17.2% |
| German Russians | 8.6 /100 | #207 | Tragic 17.4% |
| Pennsylvania Germans | 7.5 /100 | #208 | Tragic 17.4% |
| Panamanians | 6.9 /100 | #209 | Tragic 17.5% |
Demographics Similar to Laotians by Child Poverty Under the Age of 16
In terms of child poverty under the age of 16, the demographic groups most similar to Laotians are Immigrants from Bulgaria (14.3%, a difference of 0.080%), European (14.3%, a difference of 0.10%), Slovene (14.3%, a difference of 0.14%), Immigrants from Netherlands (14.3%, a difference of 0.18%), and Immigrants from Poland (14.3%, a difference of 0.18%).
| Demographics | Rating | Rank | Child Poverty Under the Age of 16 |
| Immigrants | Sweden | 98.5 /100 | #61 | Exceptional 14.2% |
| Zimbabweans | 98.5 /100 | #62 | Exceptional 14.2% |
| Immigrants | Europe | 98.4 /100 | #63 | Exceptional 14.2% |
| Immigrants | Romania | 98.3 /100 | #64 | Exceptional 14.2% |
| Immigrants | Philippines | 98.2 /100 | #65 | Exceptional 14.3% |
| Slovenes | 98.1 /100 | #66 | Exceptional 14.3% |
| Europeans | 98.1 /100 | #67 | Exceptional 14.3% |
| Laotians | 98.0 /100 | #68 | Exceptional 14.3% |
| Immigrants | Bulgaria | 98.0 /100 | #69 | Exceptional 14.3% |
| Immigrants | Netherlands | 97.9 /100 | #70 | Exceptional 14.3% |
| Immigrants | Poland | 97.9 /100 | #71 | Exceptional 14.3% |
| Cambodians | 97.8 /100 | #72 | Exceptional 14.4% |
| Immigrants | Turkey | 97.6 /100 | #73 | Exceptional 14.4% |
| Macedonians | 97.6 /100 | #74 | Exceptional 14.4% |
| Ukrainians | 97.5 /100 | #75 | Exceptional 14.4% |