Okinawan vs Laotian Child Poverty Under the Age of 16
COMPARE
Okinawan
Laotian
Child Poverty Under the Age of 16
Child Poverty Under the Age of 16 Comparison
Okinawans
Laotians
13.1%
CHILD POVERTY UNDER THE AGE OF 16
99.8/ 100
METRIC RATING
20th/ 347
METRIC RANK
14.3%
CHILD POVERTY UNDER THE AGE OF 16
98.0/ 100
METRIC RATING
68th/ 347
METRIC RANK
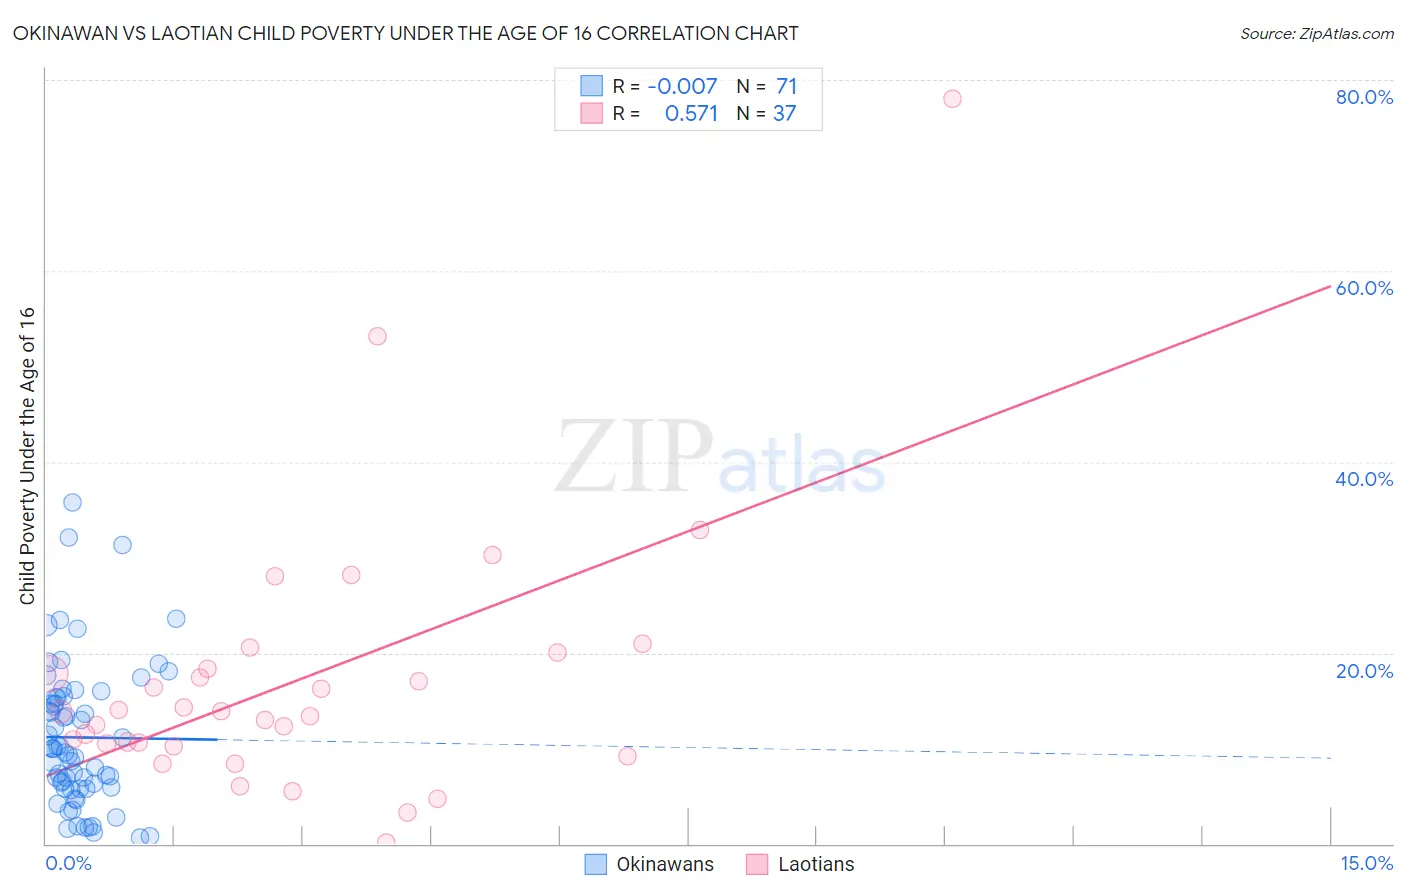
Okinawan vs Laotian Child Poverty Under the Age of 16 Correlation Chart
The statistical analysis conducted on geographies consisting of 73,512,970 people shows no correlation between the proportion of Okinawans and poverty level among children under the age of 16 in the United States with a correlation coefficient (R) of -0.007 and weighted average of 13.1%. Similarly, the statistical analysis conducted on geographies consisting of 223,849,875 people shows a substantial positive correlation between the proportion of Laotians and poverty level among children under the age of 16 in the United States with a correlation coefficient (R) of 0.571 and weighted average of 14.3%, a difference of 9.0%.
Child Poverty Under the Age of 16 Correlation Summary
| Measurement | Okinawan | Laotian |
| Minimum | 0.69% | 0.17% |
| Maximum | 35.7% | 78.1% |
| Range | 35.0% | 77.9% |
| Mean | 11.1% | 17.1% |
| Median | 10.0% | 13.8% |
| Interquartile 25% (IQ1) | 5.8% | 10.4% |
| Interquartile 75% (IQ3) | 15.3% | 19.1% |
| Interquartile Range (IQR) | 9.5% | 8.8% |
| Standard Deviation (Sample) | 7.5% | 14.1% |
| Standard Deviation (Population) | 7.5% | 13.9% |
Similar Demographics by Child Poverty Under the Age of 16
Demographics Similar to Okinawans by Child Poverty Under the Age of 16
In terms of child poverty under the age of 16, the demographic groups most similar to Okinawans are Immigrants from Eastern Asia (13.1%, a difference of 0.030%), Maltese (13.1%, a difference of 0.11%), Indian (Asian) (13.1%, a difference of 0.15%), Latvian (13.2%, a difference of 0.36%), and Eastern European (13.2%, a difference of 0.44%).
| Demographics | Rating | Rank | Child Poverty Under the Age of 16 |
| Burmese | 99.9 /100 | #13 | Exceptional 12.8% |
| Immigrants | Lithuania | 99.9 /100 | #14 | Exceptional 12.9% |
| Immigrants | Korea | 99.9 /100 | #15 | Exceptional 13.0% |
| Norwegians | 99.9 /100 | #16 | Exceptional 13.0% |
| Bulgarians | 99.9 /100 | #17 | Exceptional 13.0% |
| Cypriots | 99.9 /100 | #18 | Exceptional 13.0% |
| Immigrants | Japan | 99.8 /100 | #19 | Exceptional 13.0% |
| Okinawans | 99.8 /100 | #20 | Exceptional 13.1% |
| Immigrants | Eastern Asia | 99.8 /100 | #21 | Exceptional 13.1% |
| Maltese | 99.8 /100 | #22 | Exceptional 13.1% |
| Indians (Asian) | 99.8 /100 | #23 | Exceptional 13.1% |
| Latvians | 99.8 /100 | #24 | Exceptional 13.2% |
| Eastern Europeans | 99.8 /100 | #25 | Exceptional 13.2% |
| Bolivians | 99.8 /100 | #26 | Exceptional 13.2% |
| Immigrants | China | 99.8 /100 | #27 | Exceptional 13.3% |
Demographics Similar to Laotians by Child Poverty Under the Age of 16
In terms of child poverty under the age of 16, the demographic groups most similar to Laotians are Immigrants from Bulgaria (14.3%, a difference of 0.080%), European (14.3%, a difference of 0.10%), Slovene (14.3%, a difference of 0.14%), Immigrants from Netherlands (14.3%, a difference of 0.18%), and Immigrants from Poland (14.3%, a difference of 0.18%).
| Demographics | Rating | Rank | Child Poverty Under the Age of 16 |
| Immigrants | Sweden | 98.5 /100 | #61 | Exceptional 14.2% |
| Zimbabweans | 98.5 /100 | #62 | Exceptional 14.2% |
| Immigrants | Europe | 98.4 /100 | #63 | Exceptional 14.2% |
| Immigrants | Romania | 98.3 /100 | #64 | Exceptional 14.2% |
| Immigrants | Philippines | 98.2 /100 | #65 | Exceptional 14.3% |
| Slovenes | 98.1 /100 | #66 | Exceptional 14.3% |
| Europeans | 98.1 /100 | #67 | Exceptional 14.3% |
| Laotians | 98.0 /100 | #68 | Exceptional 14.3% |
| Immigrants | Bulgaria | 98.0 /100 | #69 | Exceptional 14.3% |
| Immigrants | Netherlands | 97.9 /100 | #70 | Exceptional 14.3% |
| Immigrants | Poland | 97.9 /100 | #71 | Exceptional 14.3% |
| Cambodians | 97.8 /100 | #72 | Exceptional 14.4% |
| Immigrants | Turkey | 97.6 /100 | #73 | Exceptional 14.4% |
| Macedonians | 97.6 /100 | #74 | Exceptional 14.4% |
| Ukrainians | 97.5 /100 | #75 | Exceptional 14.4% |