Yugoslavian vs Laotian Child Poverty Under the Age of 16
COMPARE
Yugoslavian
Laotian
Child Poverty Under the Age of 16
Child Poverty Under the Age of 16 Comparison
Yugoslavians
Laotians
15.8%
CHILD POVERTY UNDER THE AGE OF 16
67.6/ 100
METRIC RATING
163rd/ 347
METRIC RANK
14.3%
CHILD POVERTY UNDER THE AGE OF 16
98.0/ 100
METRIC RATING
68th/ 347
METRIC RANK
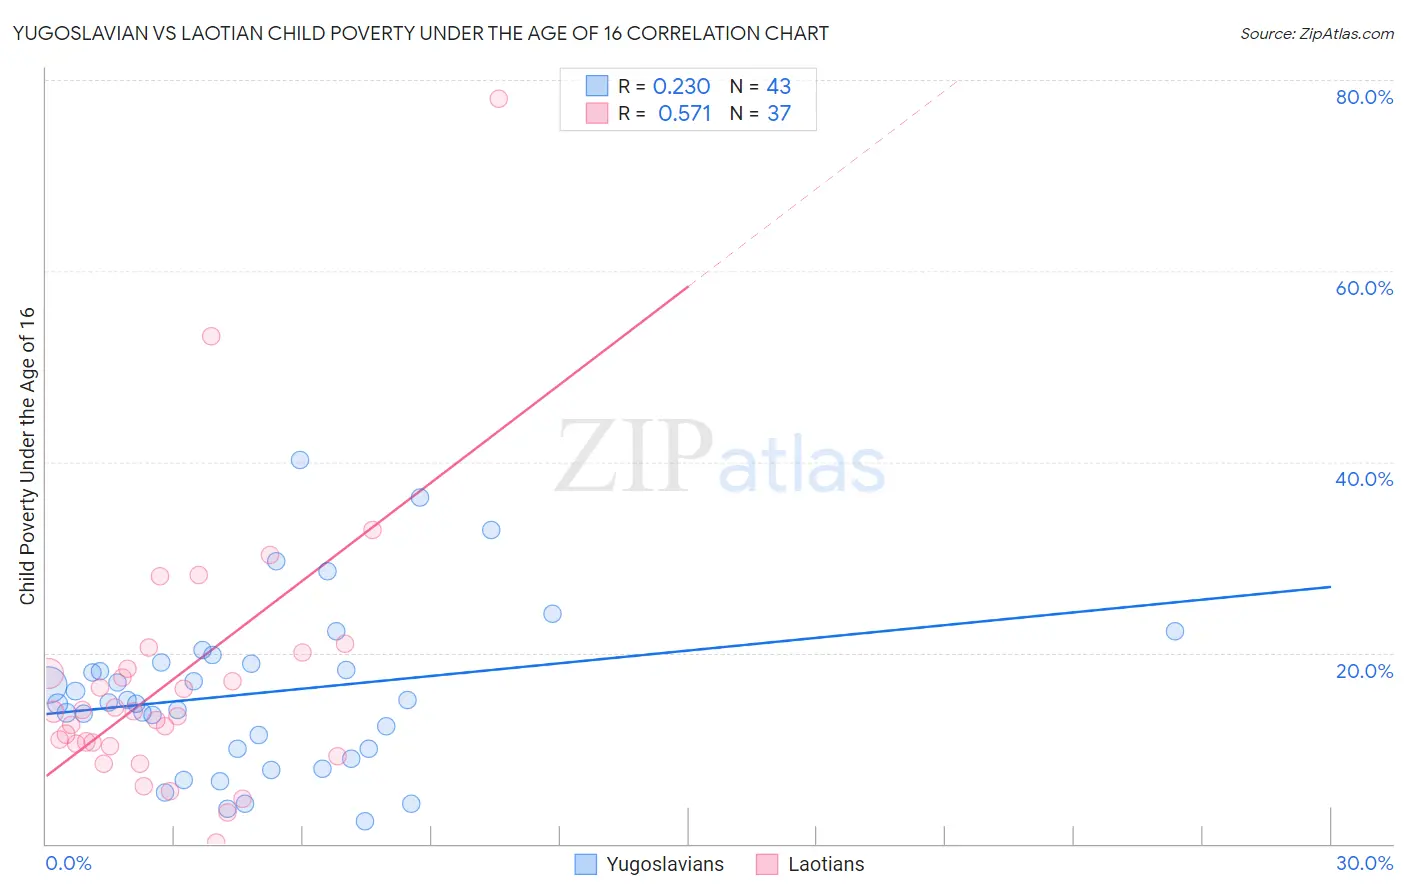
Yugoslavian vs Laotian Child Poverty Under the Age of 16 Correlation Chart
The statistical analysis conducted on geographies consisting of 283,940,163 people shows a weak positive correlation between the proportion of Yugoslavians and poverty level among children under the age of 16 in the United States with a correlation coefficient (R) of 0.230 and weighted average of 15.8%. Similarly, the statistical analysis conducted on geographies consisting of 223,849,875 people shows a substantial positive correlation between the proportion of Laotians and poverty level among children under the age of 16 in the United States with a correlation coefficient (R) of 0.571 and weighted average of 14.3%, a difference of 10.7%.
Child Poverty Under the Age of 16 Correlation Summary
| Measurement | Yugoslavian | Laotian |
| Minimum | 2.3% | 0.17% |
| Maximum | 40.2% | 78.1% |
| Range | 37.9% | 77.9% |
| Mean | 15.8% | 17.1% |
| Median | 14.8% | 13.8% |
| Interquartile 25% (IQ1) | 10.0% | 10.4% |
| Interquartile 75% (IQ3) | 18.9% | 19.1% |
| Interquartile Range (IQR) | 8.9% | 8.8% |
| Standard Deviation (Sample) | 8.5% | 14.1% |
| Standard Deviation (Population) | 8.4% | 13.9% |
Similar Demographics by Child Poverty Under the Age of 16
Demographics Similar to Yugoslavians by Child Poverty Under the Age of 16
In terms of child poverty under the age of 16, the demographic groups most similar to Yugoslavians are Colombian (15.8%, a difference of 0.0%), Immigrants from Germany (15.8%, a difference of 0.040%), Immigrants from Northern Africa (15.8%, a difference of 0.060%), Guamanian/Chamorro (15.9%, a difference of 0.17%), and Immigrants from Oceania (15.9%, a difference of 0.30%).
| Demographics | Rating | Rank | Child Poverty Under the Age of 16 |
| Immigrants | Venezuela | 74.9 /100 | #156 | Good 15.7% |
| Immigrants | Nepal | 72.9 /100 | #157 | Good 15.7% |
| Immigrants | Chile | 72.8 /100 | #158 | Good 15.7% |
| Immigrants | Fiji | 71.1 /100 | #159 | Good 15.8% |
| Immigrants | Albania | 70.7 /100 | #160 | Good 15.8% |
| Immigrants | Northern Africa | 68.1 /100 | #161 | Good 15.8% |
| Colombians | 67.6 /100 | #162 | Good 15.8% |
| Yugoslavians | 67.6 /100 | #163 | Good 15.8% |
| Immigrants | Germany | 67.3 /100 | #164 | Good 15.8% |
| Guamanians/Chamorros | 66.4 /100 | #165 | Good 15.9% |
| Immigrants | Oceania | 65.4 /100 | #166 | Good 15.9% |
| Costa Ricans | 61.1 /100 | #167 | Good 16.0% |
| South Americans | 57.9 /100 | #168 | Average 16.0% |
| Uruguayans | 54.7 /100 | #169 | Average 16.1% |
| Immigrants | Colombia | 54.4 /100 | #170 | Average 16.1% |
Demographics Similar to Laotians by Child Poverty Under the Age of 16
In terms of child poverty under the age of 16, the demographic groups most similar to Laotians are Immigrants from Bulgaria (14.3%, a difference of 0.080%), European (14.3%, a difference of 0.10%), Slovene (14.3%, a difference of 0.14%), Immigrants from Netherlands (14.3%, a difference of 0.18%), and Immigrants from Poland (14.3%, a difference of 0.18%).
| Demographics | Rating | Rank | Child Poverty Under the Age of 16 |
| Immigrants | Sweden | 98.5 /100 | #61 | Exceptional 14.2% |
| Zimbabweans | 98.5 /100 | #62 | Exceptional 14.2% |
| Immigrants | Europe | 98.4 /100 | #63 | Exceptional 14.2% |
| Immigrants | Romania | 98.3 /100 | #64 | Exceptional 14.2% |
| Immigrants | Philippines | 98.2 /100 | #65 | Exceptional 14.3% |
| Slovenes | 98.1 /100 | #66 | Exceptional 14.3% |
| Europeans | 98.1 /100 | #67 | Exceptional 14.3% |
| Laotians | 98.0 /100 | #68 | Exceptional 14.3% |
| Immigrants | Bulgaria | 98.0 /100 | #69 | Exceptional 14.3% |
| Immigrants | Netherlands | 97.9 /100 | #70 | Exceptional 14.3% |
| Immigrants | Poland | 97.9 /100 | #71 | Exceptional 14.3% |
| Cambodians | 97.8 /100 | #72 | Exceptional 14.4% |
| Immigrants | Turkey | 97.6 /100 | #73 | Exceptional 14.4% |
| Macedonians | 97.6 /100 | #74 | Exceptional 14.4% |
| Ukrainians | 97.5 /100 | #75 | Exceptional 14.4% |