Ugandan vs Afghan Child Poverty Under the Age of 16
COMPARE
Ugandan
Afghan
Child Poverty Under the Age of 16
Child Poverty Under the Age of 16 Comparison
Ugandans
Afghans
17.1%
CHILD POVERTY UNDER THE AGE OF 16
14.3/ 100
METRIC RATING
202nd/ 347
METRIC RANK
16.2%
CHILD POVERTY UNDER THE AGE OF 16
52.3/ 100
METRIC RATING
172nd/ 347
METRIC RANK
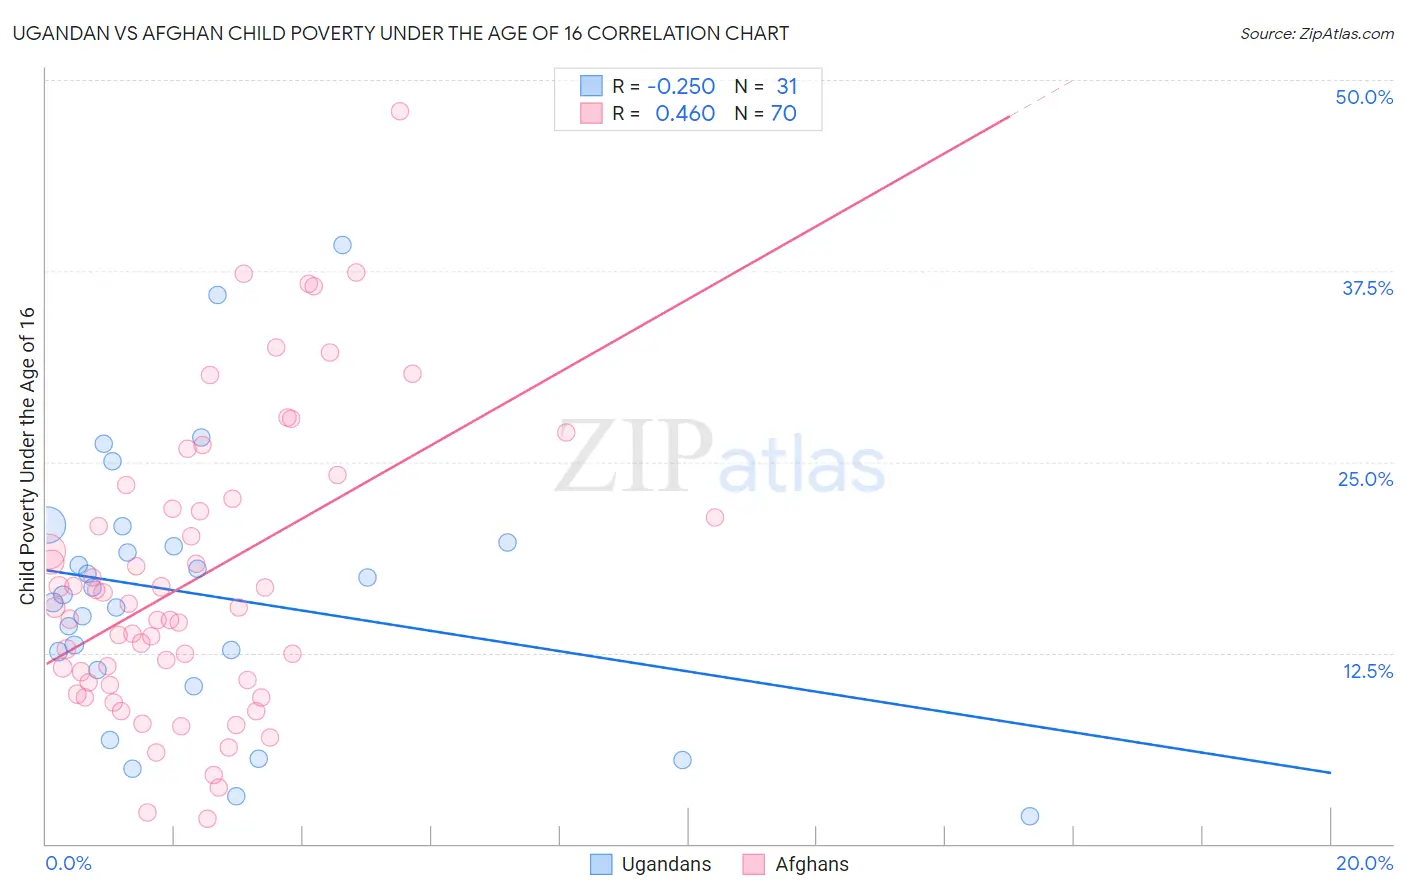
Ugandan vs Afghan Child Poverty Under the Age of 16 Correlation Chart
The statistical analysis conducted on geographies consisting of 93,855,381 people shows a weak negative correlation between the proportion of Ugandans and poverty level among children under the age of 16 in the United States with a correlation coefficient (R) of -0.250 and weighted average of 17.1%. Similarly, the statistical analysis conducted on geographies consisting of 148,458,786 people shows a moderate positive correlation between the proportion of Afghans and poverty level among children under the age of 16 in the United States with a correlation coefficient (R) of 0.460 and weighted average of 16.2%, a difference of 5.7%.
Child Poverty Under the Age of 16 Correlation Summary
| Measurement | Ugandan | Afghan |
| Minimum | 1.8% | 1.6% |
| Maximum | 39.2% | 48.0% |
| Range | 37.4% | 46.4% |
| Mean | 16.3% | 17.3% |
| Median | 16.3% | 15.5% |
| Interquartile 25% (IQ1) | 11.4% | 10.6% |
| Interquartile 75% (IQ3) | 19.7% | 21.9% |
| Interquartile Range (IQR) | 8.3% | 11.3% |
| Standard Deviation (Sample) | 8.6% | 9.5% |
| Standard Deviation (Population) | 8.4% | 9.4% |
Similar Demographics by Child Poverty Under the Age of 16
Demographics Similar to Ugandans by Child Poverty Under the Age of 16
In terms of child poverty under the age of 16, the demographic groups most similar to Ugandans are Immigrants from Sierra Leone (17.1%, a difference of 0.020%), Immigrants from Uzbekistan (17.1%, a difference of 0.080%), Hmong (17.1%, a difference of 0.080%), Immigrants from Cameroon (17.1%, a difference of 0.090%), and Aleut (17.1%, a difference of 0.090%).
| Demographics | Rating | Rank | Child Poverty Under the Age of 16 |
| Immigrants | Uganda | 22.5 /100 | #195 | Fair 16.8% |
| Immigrants | Lebanon | 22.0 /100 | #196 | Fair 16.8% |
| Immigrants | Kenya | 19.1 /100 | #197 | Poor 16.9% |
| Delaware | 17.1 /100 | #198 | Poor 17.0% |
| Immigrants | Afghanistan | 15.1 /100 | #199 | Poor 17.0% |
| Immigrants | Cameroon | 14.7 /100 | #200 | Poor 17.1% |
| Immigrants | Uzbekistan | 14.7 /100 | #201 | Poor 17.1% |
| Ugandans | 14.3 /100 | #202 | Poor 17.1% |
| Immigrants | Sierra Leone | 14.2 /100 | #203 | Poor 17.1% |
| Hmong | 14.0 /100 | #204 | Poor 17.1% |
| Aleuts | 13.9 /100 | #205 | Poor 17.1% |
| Alaska Natives | 11.8 /100 | #206 | Poor 17.2% |
| German Russians | 8.6 /100 | #207 | Tragic 17.4% |
| Pennsylvania Germans | 7.5 /100 | #208 | Tragic 17.4% |
| Panamanians | 6.9 /100 | #209 | Tragic 17.5% |
Demographics Similar to Afghans by Child Poverty Under the Age of 16
In terms of child poverty under the age of 16, the demographic groups most similar to Afghans are Hungarian (16.2%, a difference of 0.020%), Immigrants from Saudi Arabia (16.2%, a difference of 0.020%), Immigrants from Colombia (16.1%, a difference of 0.26%), White/Caucasian (16.2%, a difference of 0.27%), and Uruguayan (16.1%, a difference of 0.29%).
| Demographics | Rating | Rank | Child Poverty Under the Age of 16 |
| Guamanians/Chamorros | 66.4 /100 | #165 | Good 15.9% |
| Immigrants | Oceania | 65.4 /100 | #166 | Good 15.9% |
| Costa Ricans | 61.1 /100 | #167 | Good 16.0% |
| South Americans | 57.9 /100 | #168 | Average 16.0% |
| Uruguayans | 54.7 /100 | #169 | Average 16.1% |
| Immigrants | Colombia | 54.4 /100 | #170 | Average 16.1% |
| Hungarians | 52.5 /100 | #171 | Average 16.2% |
| Afghans | 52.3 /100 | #172 | Average 16.2% |
| Immigrants | Saudi Arabia | 52.1 /100 | #173 | Average 16.2% |
| Whites/Caucasians | 50.0 /100 | #174 | Average 16.2% |
| Scotch-Irish | 47.1 /100 | #175 | Average 16.3% |
| Lebanese | 45.9 /100 | #176 | Average 16.3% |
| Ethiopians | 43.4 /100 | #177 | Average 16.3% |
| Immigrants | Ethiopia | 42.3 /100 | #178 | Average 16.4% |
| Immigrants | Syria | 42.3 /100 | #179 | Average 16.4% |