Ugandan vs Immigrants from Guatemala Male Poverty
COMPARE
Ugandan
Immigrants from Guatemala
Male Poverty
Male Poverty Comparison
Ugandans
Immigrants from Guatemala
12.2%
MALE POVERTY
2.2/ 100
METRIC RATING
221st/ 347
METRIC RANK
14.0%
MALE POVERTY
0.0/ 100
METRIC RATING
299th/ 347
METRIC RANK
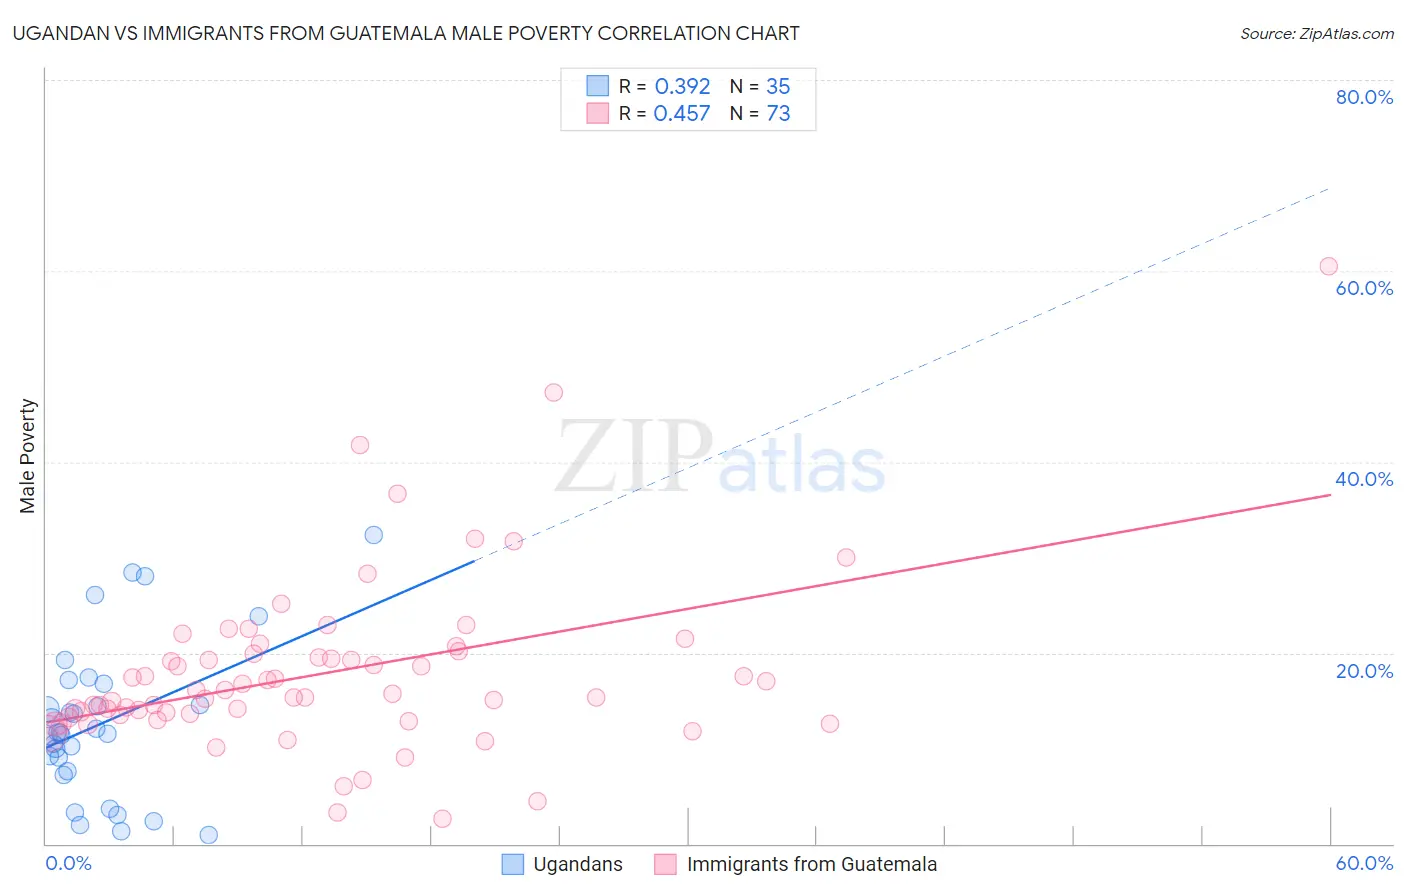
Ugandan vs Immigrants from Guatemala Male Poverty Correlation Chart
The statistical analysis conducted on geographies consisting of 93,987,101 people shows a mild positive correlation between the proportion of Ugandans and poverty level among males in the United States with a correlation coefficient (R) of 0.392 and weighted average of 12.2%. Similarly, the statistical analysis conducted on geographies consisting of 377,090,966 people shows a moderate positive correlation between the proportion of Immigrants from Guatemala and poverty level among males in the United States with a correlation coefficient (R) of 0.457 and weighted average of 14.0%, a difference of 14.6%.
Male Poverty Correlation Summary
| Measurement | Ugandan | Immigrants from Guatemala |
| Minimum | 0.96% | 2.7% |
| Maximum | 32.3% | 60.5% |
| Range | 31.3% | 57.9% |
| Mean | 12.6% | 17.9% |
| Median | 11.6% | 15.7% |
| Interquartile 25% (IQ1) | 7.6% | 13.4% |
| Interquartile 75% (IQ3) | 16.8% | 20.1% |
| Interquartile Range (IQR) | 9.2% | 6.7% |
| Standard Deviation (Sample) | 7.9% | 9.2% |
| Standard Deviation (Population) | 7.8% | 9.1% |
Similar Demographics by Male Poverty
Demographics Similar to Ugandans by Male Poverty
In terms of male poverty, the demographic groups most similar to Ugandans are Immigrants from Africa (12.2%, a difference of 0.020%), Immigrants from Micronesia (12.2%, a difference of 0.040%), Immigrants from Eritrea (12.2%, a difference of 0.21%), Bermudan (12.2%, a difference of 0.23%), and German Russian (12.2%, a difference of 0.29%).
| Demographics | Rating | Rank | Male Poverty |
| Japanese | 2.7 /100 | #214 | Tragic 12.2% |
| Immigrants | Uzbekistan | 2.6 /100 | #215 | Tragic 12.2% |
| Immigrants | Cambodia | 2.5 /100 | #216 | Tragic 12.2% |
| Immigrants | Thailand | 2.5 /100 | #217 | Tragic 12.2% |
| German Russians | 2.5 /100 | #218 | Tragic 12.2% |
| Bermudans | 2.4 /100 | #219 | Tragic 12.2% |
| Immigrants | Eritrea | 2.4 /100 | #220 | Tragic 12.2% |
| Ugandans | 2.2 /100 | #221 | Tragic 12.2% |
| Immigrants | Africa | 2.1 /100 | #222 | Tragic 12.2% |
| Immigrants | Micronesia | 2.1 /100 | #223 | Tragic 12.2% |
| Immigrants | Nigeria | 1.6 /100 | #224 | Tragic 12.3% |
| Osage | 1.5 /100 | #225 | Tragic 12.3% |
| Nigerians | 1.4 /100 | #226 | Tragic 12.3% |
| Alaska Natives | 1.4 /100 | #227 | Tragic 12.4% |
| Alsatians | 1.3 /100 | #228 | Tragic 12.4% |
Demographics Similar to Immigrants from Guatemala by Male Poverty
In terms of male poverty, the demographic groups most similar to Immigrants from Guatemala are Blackfeet (14.0%, a difference of 0.10%), Immigrants from Mexico (14.0%, a difference of 0.12%), Inupiat (14.0%, a difference of 0.13%), Immigrants from Senegal (14.0%, a difference of 0.18%), and Immigrants from Caribbean (14.0%, a difference of 0.24%).
| Demographics | Rating | Rank | Male Poverty |
| Indonesians | 0.0 /100 | #292 | Tragic 13.8% |
| Immigrants | Belize | 0.0 /100 | #293 | Tragic 13.8% |
| Hispanics or Latinos | 0.0 /100 | #294 | Tragic 13.9% |
| Immigrants | Central America | 0.0 /100 | #295 | Tragic 13.9% |
| Cajuns | 0.0 /100 | #296 | Tragic 13.9% |
| Inupiat | 0.0 /100 | #297 | Tragic 14.0% |
| Blackfeet | 0.0 /100 | #298 | Tragic 14.0% |
| Immigrants | Guatemala | 0.0 /100 | #299 | Tragic 14.0% |
| Immigrants | Mexico | 0.0 /100 | #300 | Tragic 14.0% |
| Immigrants | Senegal | 0.0 /100 | #301 | Tragic 14.0% |
| Immigrants | Caribbean | 0.0 /100 | #302 | Tragic 14.0% |
| Bahamians | 0.0 /100 | #303 | Tragic 14.1% |
| Senegalese | 0.0 /100 | #304 | Tragic 14.1% |
| Immigrants | Bangladesh | 0.0 /100 | #305 | Tragic 14.1% |
| Creek | 0.0 /100 | #306 | Tragic 14.1% |