Turkish vs Immigrants from Liberia Child Poverty Under the Age of 16
COMPARE
Turkish
Immigrants from Liberia
Child Poverty Under the Age of 16
Child Poverty Under the Age of 16 Comparison
Turks
Immigrants from Liberia
13.4%
CHILD POVERTY UNDER THE AGE OF 16
99.7/ 100
METRIC RATING
30th/ 347
METRIC RANK
19.7%
CHILD POVERTY UNDER THE AGE OF 16
0.1/ 100
METRIC RATING
271st/ 347
METRIC RANK
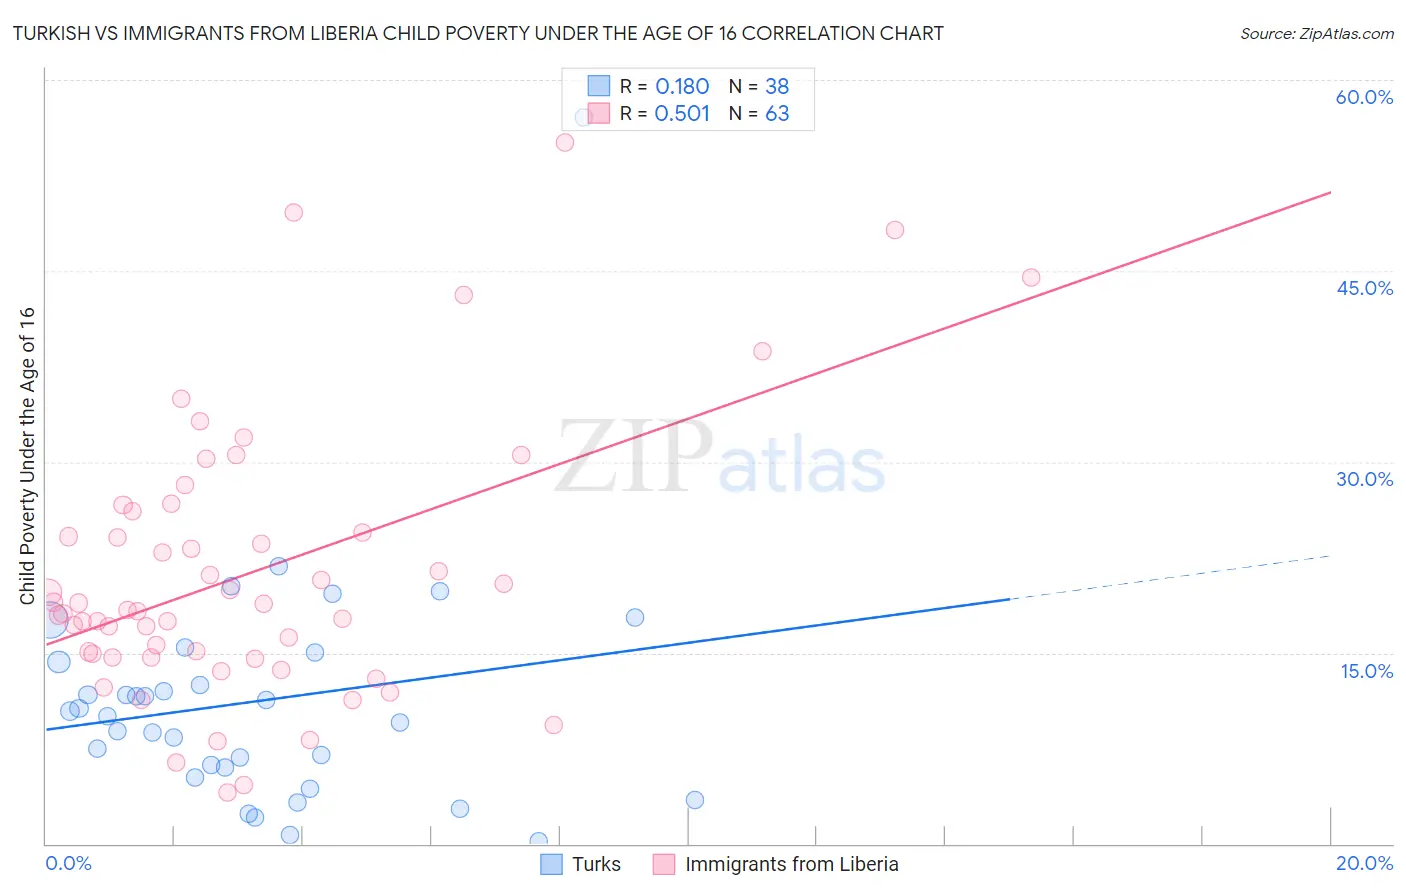
Turkish vs Immigrants from Liberia Child Poverty Under the Age of 16 Correlation Chart
The statistical analysis conducted on geographies consisting of 269,836,964 people shows a poor positive correlation between the proportion of Turks and poverty level among children under the age of 16 in the United States with a correlation coefficient (R) of 0.180 and weighted average of 13.4%. Similarly, the statistical analysis conducted on geographies consisting of 135,039,735 people shows a substantial positive correlation between the proportion of Immigrants from Liberia and poverty level among children under the age of 16 in the United States with a correlation coefficient (R) of 0.501 and weighted average of 19.7%, a difference of 47.4%.
Child Poverty Under the Age of 16 Correlation Summary
| Measurement | Turkish | Immigrants from Liberia |
| Minimum | 0.17% | 4.0% |
| Maximum | 57.0% | 55.1% |
| Range | 56.9% | 51.1% |
| Mean | 11.2% | 21.3% |
| Median | 10.2% | 18.4% |
| Interquartile 25% (IQ1) | 6.0% | 14.6% |
| Interquartile 75% (IQ3) | 14.3% | 26.1% |
| Interquartile Range (IQR) | 8.3% | 11.5% |
| Standard Deviation (Sample) | 9.5% | 10.8% |
| Standard Deviation (Population) | 9.4% | 10.7% |
Similar Demographics by Child Poverty Under the Age of 16
Demographics Similar to Turks by Child Poverty Under the Age of 16
In terms of child poverty under the age of 16, the demographic groups most similar to Turks are Danish (13.4%, a difference of 0.21%), Tongan (13.4%, a difference of 0.22%), Swedish (13.3%, a difference of 0.30%), Assyrian/Chaldean/Syriac (13.3%, a difference of 0.48%), and Asian (13.5%, a difference of 0.71%).
| Demographics | Rating | Rank | Child Poverty Under the Age of 16 |
| Indians (Asian) | 99.8 /100 | #23 | Exceptional 13.1% |
| Latvians | 99.8 /100 | #24 | Exceptional 13.2% |
| Eastern Europeans | 99.8 /100 | #25 | Exceptional 13.2% |
| Bolivians | 99.8 /100 | #26 | Exceptional 13.2% |
| Immigrants | China | 99.8 /100 | #27 | Exceptional 13.3% |
| Assyrians/Chaldeans/Syriacs | 99.7 /100 | #28 | Exceptional 13.3% |
| Swedes | 99.7 /100 | #29 | Exceptional 13.3% |
| Turks | 99.7 /100 | #30 | Exceptional 13.4% |
| Danes | 99.7 /100 | #31 | Exceptional 13.4% |
| Tongans | 99.7 /100 | #32 | Exceptional 13.4% |
| Asians | 99.6 /100 | #33 | Exceptional 13.5% |
| Russians | 99.6 /100 | #34 | Exceptional 13.5% |
| Lithuanians | 99.6 /100 | #35 | Exceptional 13.5% |
| Immigrants | Northern Europe | 99.6 /100 | #36 | Exceptional 13.6% |
| Immigrants | Bolivia | 99.6 /100 | #37 | Exceptional 13.6% |
Demographics Similar to Immigrants from Liberia by Child Poverty Under the Age of 16
In terms of child poverty under the age of 16, the demographic groups most similar to Immigrants from Liberia are Spanish American Indian (19.7%, a difference of 0.13%), Immigrants from El Salvador (19.7%, a difference of 0.15%), Jamaican (19.7%, a difference of 0.21%), Immigrants from Bangladesh (19.8%, a difference of 0.31%), and Immigrants from Jamaica (19.8%, a difference of 0.54%).
| Demographics | Rating | Rank | Child Poverty Under the Age of 16 |
| Immigrants | Ecuador | 0.1 /100 | #264 | Tragic 19.4% |
| Chickasaw | 0.1 /100 | #265 | Tragic 19.5% |
| Liberians | 0.1 /100 | #266 | Tragic 19.5% |
| Cherokee | 0.1 /100 | #267 | Tragic 19.5% |
| Jamaicans | 0.1 /100 | #268 | Tragic 19.7% |
| Immigrants | El Salvador | 0.1 /100 | #269 | Tragic 19.7% |
| Spanish American Indians | 0.1 /100 | #270 | Tragic 19.7% |
| Immigrants | Liberia | 0.1 /100 | #271 | Tragic 19.7% |
| Immigrants | Bangladesh | 0.1 /100 | #272 | Tragic 19.8% |
| Immigrants | Jamaica | 0.1 /100 | #273 | Tragic 19.8% |
| Immigrants | Cabo Verde | 0.1 /100 | #274 | Tragic 19.9% |
| Immigrants | Barbados | 0.1 /100 | #275 | Tragic 19.9% |
| Belizeans | 0.1 /100 | #276 | Tragic 19.9% |
| Iroquois | 0.1 /100 | #277 | Tragic 19.9% |
| Bangladeshis | 0.0 /100 | #278 | Tragic 19.9% |