Turkish vs Immigrants from Ireland Child Poverty Under the Age of 16
COMPARE
Turkish
Immigrants from Ireland
Child Poverty Under the Age of 16
Child Poverty Under the Age of 16 Comparison
Turks
Immigrants from Ireland
13.4%
CHILD POVERTY UNDER THE AGE OF 16
99.7/ 100
METRIC RATING
30th/ 347
METRIC RANK
12.7%
CHILD POVERTY UNDER THE AGE OF 16
99.9/ 100
METRIC RATING
12th/ 347
METRIC RANK
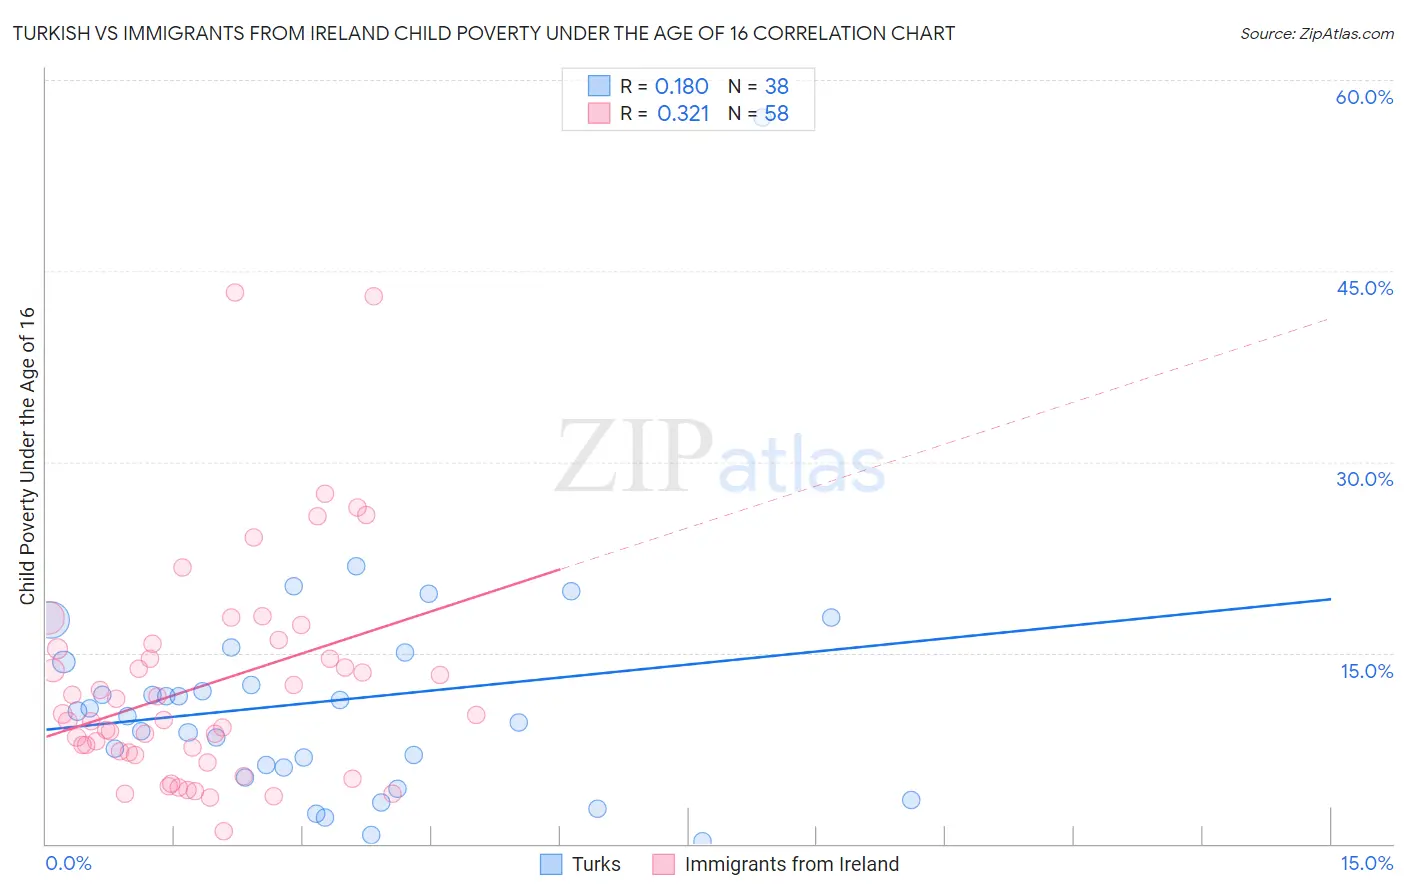
Turkish vs Immigrants from Ireland Child Poverty Under the Age of 16 Correlation Chart
The statistical analysis conducted on geographies consisting of 269,836,964 people shows a poor positive correlation between the proportion of Turks and poverty level among children under the age of 16 in the United States with a correlation coefficient (R) of 0.180 and weighted average of 13.4%. Similarly, the statistical analysis conducted on geographies consisting of 238,601,869 people shows a mild positive correlation between the proportion of Immigrants from Ireland and poverty level among children under the age of 16 in the United States with a correlation coefficient (R) of 0.321 and weighted average of 12.7%, a difference of 5.6%.
Child Poverty Under the Age of 16 Correlation Summary
| Measurement | Turkish | Immigrants from Ireland |
| Minimum | 0.17% | 0.95% |
| Maximum | 57.0% | 43.3% |
| Range | 56.9% | 42.4% |
| Mean | 11.2% | 12.4% |
| Median | 10.2% | 9.9% |
| Interquartile 25% (IQ1) | 6.0% | 7.2% |
| Interquartile 75% (IQ3) | 14.3% | 15.3% |
| Interquartile Range (IQR) | 8.3% | 8.1% |
| Standard Deviation (Sample) | 9.5% | 8.6% |
| Standard Deviation (Population) | 9.4% | 8.5% |
Demographics Similar to Turks and Immigrants from Ireland by Child Poverty Under the Age of 16
In terms of child poverty under the age of 16, the demographic groups most similar to Turks are Danish (13.4%, a difference of 0.21%), Swedish (13.3%, a difference of 0.30%), Assyrian/Chaldean/Syriac (13.3%, a difference of 0.48%), Immigrants from China (13.3%, a difference of 0.72%), and Bolivian (13.2%, a difference of 1.0%). Similarly, the demographic groups most similar to Immigrants from Ireland are Burmese (12.8%, a difference of 1.1%), Bhutanese (12.5%, a difference of 1.1%), Immigrants from Lithuania (12.9%, a difference of 1.9%), Immigrants from Korea (13.0%, a difference of 2.3%), and Norwegian (13.0%, a difference of 2.3%).
| Demographics | Rating | Rank | Child Poverty Under the Age of 16 |
| Bhutanese | 99.9 /100 | #11 | Exceptional 12.5% |
| Immigrants | Ireland | 99.9 /100 | #12 | Exceptional 12.7% |
| Burmese | 99.9 /100 | #13 | Exceptional 12.8% |
| Immigrants | Lithuania | 99.9 /100 | #14 | Exceptional 12.9% |
| Immigrants | Korea | 99.9 /100 | #15 | Exceptional 13.0% |
| Norwegians | 99.9 /100 | #16 | Exceptional 13.0% |
| Bulgarians | 99.9 /100 | #17 | Exceptional 13.0% |
| Cypriots | 99.9 /100 | #18 | Exceptional 13.0% |
| Immigrants | Japan | 99.8 /100 | #19 | Exceptional 13.0% |
| Okinawans | 99.8 /100 | #20 | Exceptional 13.1% |
| Immigrants | Eastern Asia | 99.8 /100 | #21 | Exceptional 13.1% |
| Maltese | 99.8 /100 | #22 | Exceptional 13.1% |
| Indians (Asian) | 99.8 /100 | #23 | Exceptional 13.1% |
| Latvians | 99.8 /100 | #24 | Exceptional 13.2% |
| Eastern Europeans | 99.8 /100 | #25 | Exceptional 13.2% |
| Bolivians | 99.8 /100 | #26 | Exceptional 13.2% |
| Immigrants | China | 99.8 /100 | #27 | Exceptional 13.3% |
| Assyrians/Chaldeans/Syriacs | 99.7 /100 | #28 | Exceptional 13.3% |
| Swedes | 99.7 /100 | #29 | Exceptional 13.3% |
| Turks | 99.7 /100 | #30 | Exceptional 13.4% |
| Danes | 99.7 /100 | #31 | Exceptional 13.4% |