Immigrants from Uzbekistan vs Immigrants from Liberia Child Poverty Under the Age of 16
COMPARE
Immigrants from Uzbekistan
Immigrants from Liberia
Child Poverty Under the Age of 16
Child Poverty Under the Age of 16 Comparison
Immigrants from Uzbekistan
Immigrants from Liberia
17.1%
CHILD POVERTY UNDER THE AGE OF 16
14.7/ 100
METRIC RATING
201st/ 347
METRIC RANK
19.7%
CHILD POVERTY UNDER THE AGE OF 16
0.1/ 100
METRIC RATING
271st/ 347
METRIC RANK
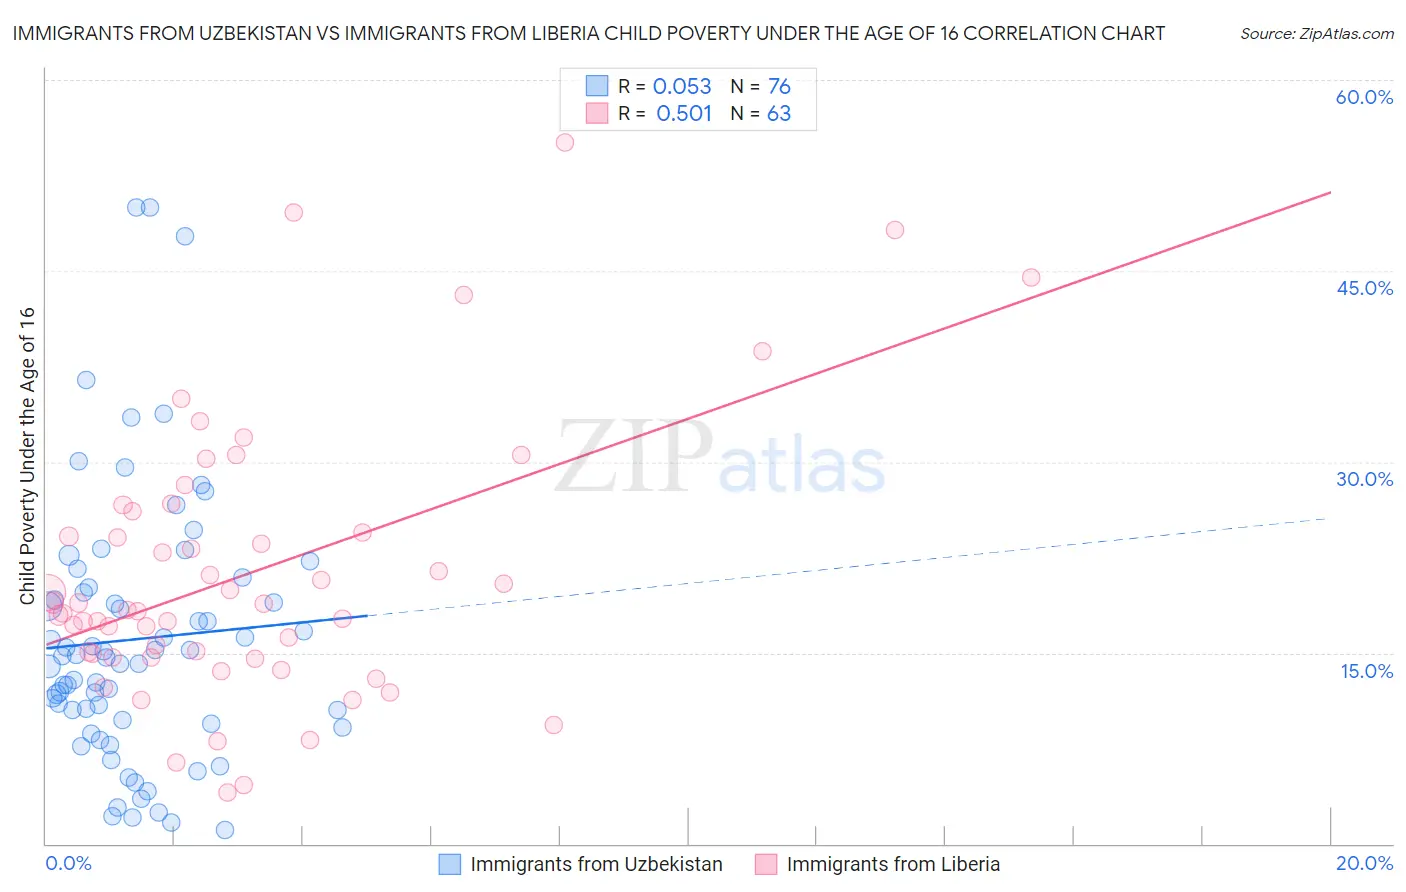
Immigrants from Uzbekistan vs Immigrants from Liberia Child Poverty Under the Age of 16 Correlation Chart
The statistical analysis conducted on geographies consisting of 118,316,672 people shows a slight positive correlation between the proportion of Immigrants from Uzbekistan and poverty level among children under the age of 16 in the United States with a correlation coefficient (R) of 0.053 and weighted average of 17.1%. Similarly, the statistical analysis conducted on geographies consisting of 135,039,735 people shows a substantial positive correlation between the proportion of Immigrants from Liberia and poverty level among children under the age of 16 in the United States with a correlation coefficient (R) of 0.501 and weighted average of 19.7%, a difference of 15.6%.
Child Poverty Under the Age of 16 Correlation Summary
| Measurement | Immigrants from Uzbekistan | Immigrants from Liberia |
| Minimum | 1.1% | 4.0% |
| Maximum | 50.0% | 55.1% |
| Range | 48.9% | 51.1% |
| Mean | 16.1% | 21.3% |
| Median | 14.7% | 18.4% |
| Interquartile 25% (IQ1) | 9.6% | 14.6% |
| Interquartile 75% (IQ3) | 19.9% | 26.1% |
| Interquartile Range (IQR) | 10.3% | 11.5% |
| Standard Deviation (Sample) | 10.5% | 10.8% |
| Standard Deviation (Population) | 10.4% | 10.7% |
Similar Demographics by Child Poverty Under the Age of 16
Demographics Similar to Immigrants from Uzbekistan by Child Poverty Under the Age of 16
In terms of child poverty under the age of 16, the demographic groups most similar to Immigrants from Uzbekistan are Immigrants from Cameroon (17.1%, a difference of 0.010%), Ugandan (17.1%, a difference of 0.080%), Immigrants from Sierra Leone (17.1%, a difference of 0.10%), Immigrants from Afghanistan (17.0%, a difference of 0.11%), and Hmong (17.1%, a difference of 0.16%).
| Demographics | Rating | Rank | Child Poverty Under the Age of 16 |
| Immigrants | Uruguay | 23.1 /100 | #194 | Fair 16.8% |
| Immigrants | Uganda | 22.5 /100 | #195 | Fair 16.8% |
| Immigrants | Lebanon | 22.0 /100 | #196 | Fair 16.8% |
| Immigrants | Kenya | 19.1 /100 | #197 | Poor 16.9% |
| Delaware | 17.1 /100 | #198 | Poor 17.0% |
| Immigrants | Afghanistan | 15.1 /100 | #199 | Poor 17.0% |
| Immigrants | Cameroon | 14.7 /100 | #200 | Poor 17.1% |
| Immigrants | Uzbekistan | 14.7 /100 | #201 | Poor 17.1% |
| Ugandans | 14.3 /100 | #202 | Poor 17.1% |
| Immigrants | Sierra Leone | 14.2 /100 | #203 | Poor 17.1% |
| Hmong | 14.0 /100 | #204 | Poor 17.1% |
| Aleuts | 13.9 /100 | #205 | Poor 17.1% |
| Alaska Natives | 11.8 /100 | #206 | Poor 17.2% |
| German Russians | 8.6 /100 | #207 | Tragic 17.4% |
| Pennsylvania Germans | 7.5 /100 | #208 | Tragic 17.4% |
Demographics Similar to Immigrants from Liberia by Child Poverty Under the Age of 16
In terms of child poverty under the age of 16, the demographic groups most similar to Immigrants from Liberia are Spanish American Indian (19.7%, a difference of 0.13%), Immigrants from El Salvador (19.7%, a difference of 0.15%), Jamaican (19.7%, a difference of 0.21%), Immigrants from Bangladesh (19.8%, a difference of 0.31%), and Immigrants from Jamaica (19.8%, a difference of 0.54%).
| Demographics | Rating | Rank | Child Poverty Under the Age of 16 |
| Immigrants | Ecuador | 0.1 /100 | #264 | Tragic 19.4% |
| Chickasaw | 0.1 /100 | #265 | Tragic 19.5% |
| Liberians | 0.1 /100 | #266 | Tragic 19.5% |
| Cherokee | 0.1 /100 | #267 | Tragic 19.5% |
| Jamaicans | 0.1 /100 | #268 | Tragic 19.7% |
| Immigrants | El Salvador | 0.1 /100 | #269 | Tragic 19.7% |
| Spanish American Indians | 0.1 /100 | #270 | Tragic 19.7% |
| Immigrants | Liberia | 0.1 /100 | #271 | Tragic 19.7% |
| Immigrants | Bangladesh | 0.1 /100 | #272 | Tragic 19.8% |
| Immigrants | Jamaica | 0.1 /100 | #273 | Tragic 19.8% |
| Immigrants | Cabo Verde | 0.1 /100 | #274 | Tragic 19.9% |
| Immigrants | Barbados | 0.1 /100 | #275 | Tragic 19.9% |
| Belizeans | 0.1 /100 | #276 | Tragic 19.9% |
| Iroquois | 0.1 /100 | #277 | Tragic 19.9% |
| Bangladeshis | 0.0 /100 | #278 | Tragic 19.9% |