Cajun vs Immigrants from Liberia Child Poverty Under the Age of 16
COMPARE
Cajun
Immigrants from Liberia
Child Poverty Under the Age of 16
Child Poverty Under the Age of 16 Comparison
Cajuns
Immigrants from Liberia
22.1%
CHILD POVERTY UNDER THE AGE OF 16
0.0/ 100
METRIC RATING
320th/ 347
METRIC RANK
19.7%
CHILD POVERTY UNDER THE AGE OF 16
0.1/ 100
METRIC RATING
271st/ 347
METRIC RANK
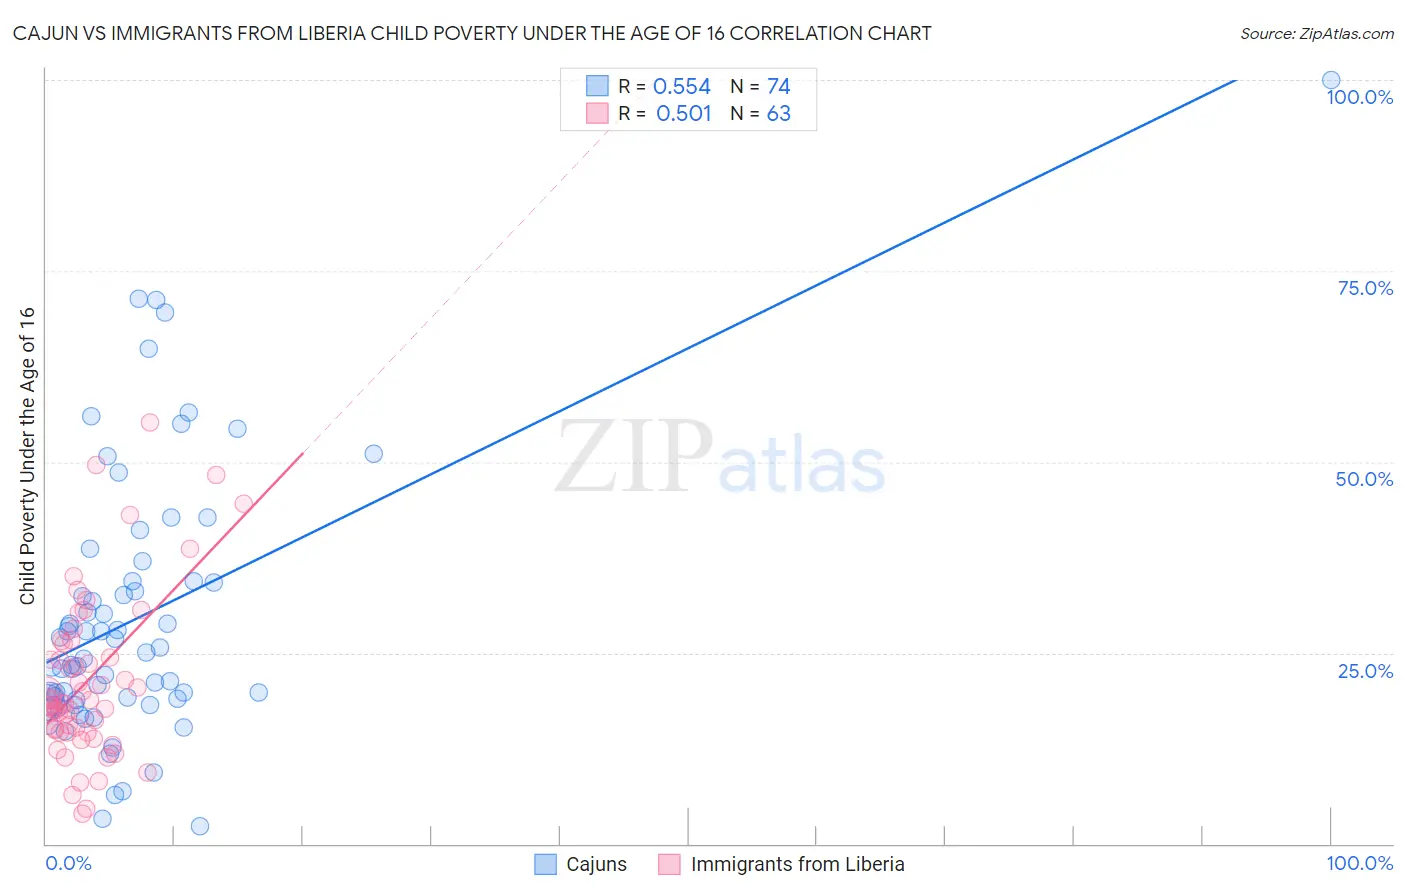
Cajun vs Immigrants from Liberia Child Poverty Under the Age of 16 Correlation Chart
The statistical analysis conducted on geographies consisting of 149,200,833 people shows a substantial positive correlation between the proportion of Cajuns and poverty level among children under the age of 16 in the United States with a correlation coefficient (R) of 0.554 and weighted average of 22.1%. Similarly, the statistical analysis conducted on geographies consisting of 135,039,735 people shows a substantial positive correlation between the proportion of Immigrants from Liberia and poverty level among children under the age of 16 in the United States with a correlation coefficient (R) of 0.501 and weighted average of 19.7%, a difference of 12.2%.
Child Poverty Under the Age of 16 Correlation Summary
| Measurement | Cajun | Immigrants from Liberia |
| Minimum | 2.4% | 4.0% |
| Maximum | 100.0% | 55.1% |
| Range | 97.6% | 51.1% |
| Mean | 29.5% | 21.3% |
| Median | 24.6% | 18.4% |
| Interquartile 25% (IQ1) | 18.9% | 14.6% |
| Interquartile 75% (IQ3) | 34.3% | 26.1% |
| Interquartile Range (IQR) | 15.4% | 11.5% |
| Standard Deviation (Sample) | 17.6% | 10.8% |
| Standard Deviation (Population) | 17.5% | 10.7% |
Similar Demographics by Child Poverty Under the Age of 16
Demographics Similar to Cajuns by Child Poverty Under the Age of 16
In terms of child poverty under the age of 16, the demographic groups most similar to Cajuns are Kiowa (22.2%, a difference of 0.19%), Yakama (22.1%, a difference of 0.20%), Honduran (22.2%, a difference of 0.37%), U.S. Virgin Islander (22.0%, a difference of 0.71%), and Immigrants from Dominica (21.9%, a difference of 1.1%).
| Demographics | Rating | Rank | Child Poverty Under the Age of 16 |
| Creek | 0.0 /100 | #313 | Tragic 21.5% |
| Immigrants | Somalia | 0.0 /100 | #314 | Tragic 21.6% |
| Immigrants | Guatemala | 0.0 /100 | #315 | Tragic 21.6% |
| Africans | 0.0 /100 | #316 | Tragic 21.7% |
| Immigrants | Dominica | 0.0 /100 | #317 | Tragic 21.9% |
| U.S. Virgin Islanders | 0.0 /100 | #318 | Tragic 22.0% |
| Yakama | 0.0 /100 | #319 | Tragic 22.1% |
| Cajuns | 0.0 /100 | #320 | Tragic 22.1% |
| Kiowa | 0.0 /100 | #321 | Tragic 22.2% |
| Hondurans | 0.0 /100 | #322 | Tragic 22.2% |
| Paiute | 0.0 /100 | #323 | Tragic 22.4% |
| Central American Indians | 0.0 /100 | #324 | Tragic 22.5% |
| Immigrants | Congo | 0.0 /100 | #325 | Tragic 22.5% |
| Immigrants | Honduras | 0.0 /100 | #326 | Tragic 22.7% |
| Menominee | 0.0 /100 | #327 | Tragic 23.0% |
Demographics Similar to Immigrants from Liberia by Child Poverty Under the Age of 16
In terms of child poverty under the age of 16, the demographic groups most similar to Immigrants from Liberia are Spanish American Indian (19.7%, a difference of 0.13%), Immigrants from El Salvador (19.7%, a difference of 0.15%), Jamaican (19.7%, a difference of 0.21%), Immigrants from Bangladesh (19.8%, a difference of 0.31%), and Immigrants from Jamaica (19.8%, a difference of 0.54%).
| Demographics | Rating | Rank | Child Poverty Under the Age of 16 |
| Immigrants | Ecuador | 0.1 /100 | #264 | Tragic 19.4% |
| Chickasaw | 0.1 /100 | #265 | Tragic 19.5% |
| Liberians | 0.1 /100 | #266 | Tragic 19.5% |
| Cherokee | 0.1 /100 | #267 | Tragic 19.5% |
| Jamaicans | 0.1 /100 | #268 | Tragic 19.7% |
| Immigrants | El Salvador | 0.1 /100 | #269 | Tragic 19.7% |
| Spanish American Indians | 0.1 /100 | #270 | Tragic 19.7% |
| Immigrants | Liberia | 0.1 /100 | #271 | Tragic 19.7% |
| Immigrants | Bangladesh | 0.1 /100 | #272 | Tragic 19.8% |
| Immigrants | Jamaica | 0.1 /100 | #273 | Tragic 19.8% |
| Immigrants | Cabo Verde | 0.1 /100 | #274 | Tragic 19.9% |
| Immigrants | Barbados | 0.1 /100 | #275 | Tragic 19.9% |
| Belizeans | 0.1 /100 | #276 | Tragic 19.9% |
| Iroquois | 0.1 /100 | #277 | Tragic 19.9% |
| Bangladeshis | 0.0 /100 | #278 | Tragic 19.9% |