Immigrants from Latin America vs Immigrants from Ireland Child Poverty Under the Age of 16
COMPARE
Immigrants from Latin America
Immigrants from Ireland
Child Poverty Under the Age of 16
Child Poverty Under the Age of 16 Comparison
Immigrants from Latin America
Immigrants from Ireland
20.5%
CHILD POVERTY UNDER THE AGE OF 16
0.0/ 100
METRIC RATING
292nd/ 347
METRIC RANK
12.7%
CHILD POVERTY UNDER THE AGE OF 16
99.9/ 100
METRIC RATING
12th/ 347
METRIC RANK
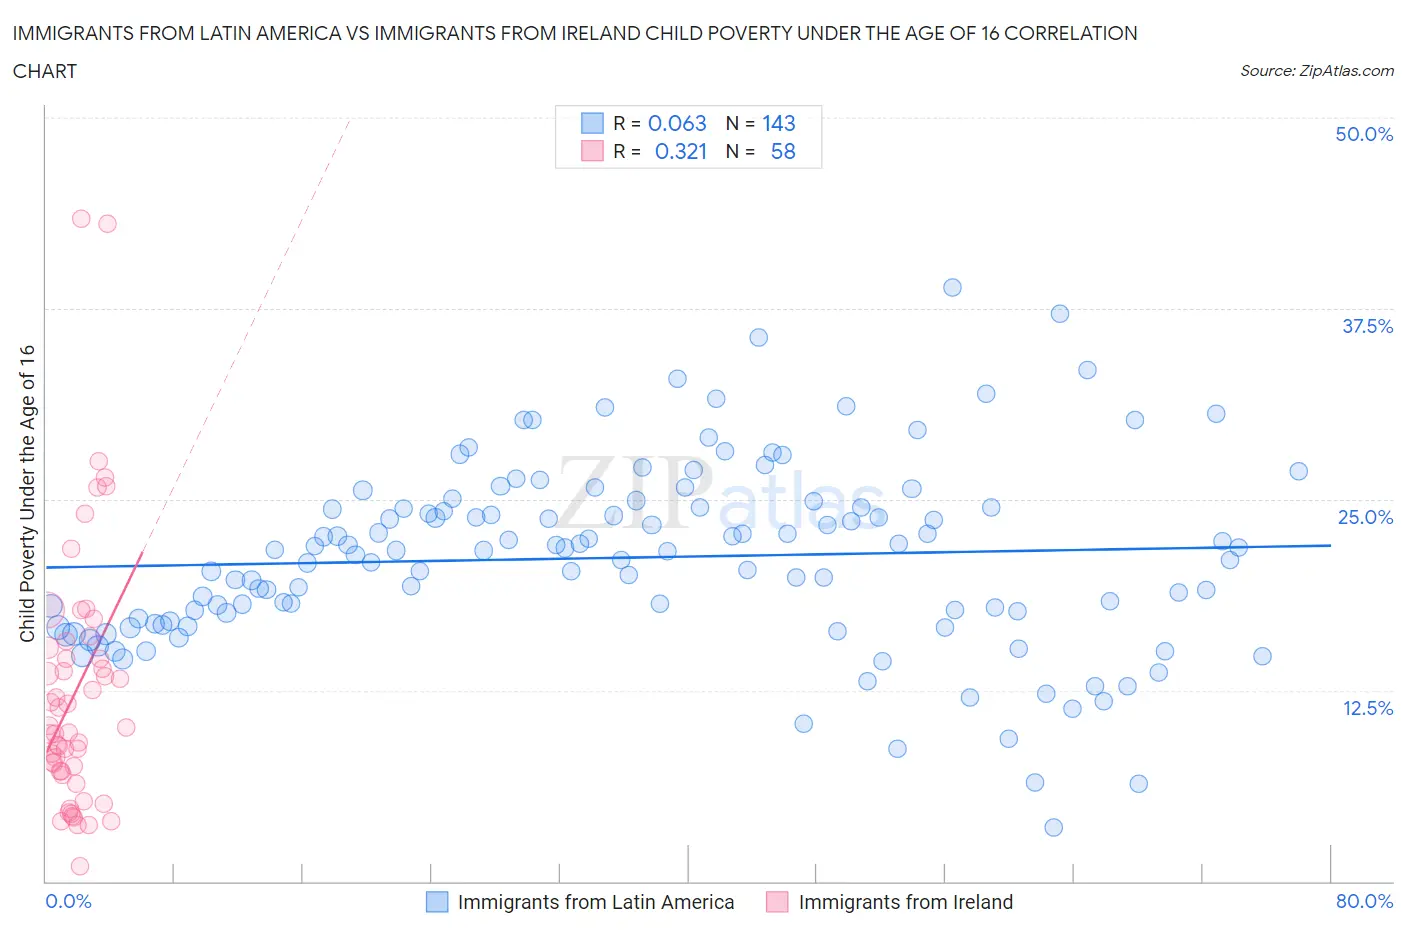
Immigrants from Latin America vs Immigrants from Ireland Child Poverty Under the Age of 16 Correlation Chart
The statistical analysis conducted on geographies consisting of 548,259,173 people shows a slight positive correlation between the proportion of Immigrants from Latin America and poverty level among children under the age of 16 in the United States with a correlation coefficient (R) of 0.063 and weighted average of 20.5%. Similarly, the statistical analysis conducted on geographies consisting of 238,601,869 people shows a mild positive correlation between the proportion of Immigrants from Ireland and poverty level among children under the age of 16 in the United States with a correlation coefficient (R) of 0.321 and weighted average of 12.7%, a difference of 62.0%.
Child Poverty Under the Age of 16 Correlation Summary
| Measurement | Immigrants from Latin America | Immigrants from Ireland |
| Minimum | 3.5% | 0.95% |
| Maximum | 38.9% | 43.3% |
| Range | 35.4% | 42.4% |
| Mean | 21.2% | 12.4% |
| Median | 21.6% | 9.9% |
| Interquartile 25% (IQ1) | 17.0% | 7.2% |
| Interquartile 75% (IQ3) | 24.4% | 15.3% |
| Interquartile Range (IQR) | 7.4% | 8.1% |
| Standard Deviation (Sample) | 6.1% | 8.6% |
| Standard Deviation (Population) | 6.1% | 8.5% |
Similar Demographics by Child Poverty Under the Age of 16
Demographics Similar to Immigrants from Latin America by Child Poverty Under the Age of 16
In terms of child poverty under the age of 16, the demographic groups most similar to Immigrants from Latin America are Chippewa (20.5%, a difference of 0.040%), Immigrants from Senegal (20.6%, a difference of 0.43%), Haitian (20.7%, a difference of 0.64%), Mexican (20.7%, a difference of 0.77%), and Yaqui (20.4%, a difference of 0.79%).
| Demographics | Rating | Rank | Child Poverty Under the Age of 16 |
| Immigrants | St. Vincent and the Grenadines | 0.0 /100 | #285 | Tragic 20.1% |
| Immigrants | West Indies | 0.0 /100 | #286 | Tragic 20.2% |
| Blackfeet | 0.0 /100 | #287 | Tragic 20.2% |
| Immigrants | Belize | 0.0 /100 | #288 | Tragic 20.3% |
| Senegalese | 0.0 /100 | #289 | Tragic 20.4% |
| Yaqui | 0.0 /100 | #290 | Tragic 20.4% |
| Chippewa | 0.0 /100 | #291 | Tragic 20.5% |
| Immigrants | Latin America | 0.0 /100 | #292 | Tragic 20.5% |
| Immigrants | Senegal | 0.0 /100 | #293 | Tragic 20.6% |
| Haitians | 0.0 /100 | #294 | Tragic 20.7% |
| Mexicans | 0.0 /100 | #295 | Tragic 20.7% |
| Immigrants | Caribbean | 0.0 /100 | #296 | Tragic 20.8% |
| Hispanics or Latinos | 0.0 /100 | #297 | Tragic 20.8% |
| Arapaho | 0.0 /100 | #298 | Tragic 20.8% |
| Immigrants | Haiti | 0.0 /100 | #299 | Tragic 20.9% |
Demographics Similar to Immigrants from Ireland by Child Poverty Under the Age of 16
In terms of child poverty under the age of 16, the demographic groups most similar to Immigrants from Ireland are Burmese (12.8%, a difference of 1.1%), Bhutanese (12.5%, a difference of 1.1%), Immigrants from South Central Asia (12.5%, a difference of 1.1%), Immigrants from Lithuania (12.9%, a difference of 1.9%), and Immigrants from Korea (13.0%, a difference of 2.3%).
| Demographics | Rating | Rank | Child Poverty Under the Age of 16 |
| Chinese | 100.0 /100 | #5 | Exceptional 11.9% |
| Immigrants | Hong Kong | 100.0 /100 | #6 | Exceptional 12.1% |
| Iranians | 100.0 /100 | #7 | Exceptional 12.2% |
| Immigrants | Singapore | 100.0 /100 | #8 | Exceptional 12.4% |
| Immigrants | Iran | 100.0 /100 | #9 | Exceptional 12.4% |
| Immigrants | South Central Asia | 99.9 /100 | #10 | Exceptional 12.5% |
| Bhutanese | 99.9 /100 | #11 | Exceptional 12.5% |
| Immigrants | Ireland | 99.9 /100 | #12 | Exceptional 12.7% |
| Burmese | 99.9 /100 | #13 | Exceptional 12.8% |
| Immigrants | Lithuania | 99.9 /100 | #14 | Exceptional 12.9% |
| Immigrants | Korea | 99.9 /100 | #15 | Exceptional 13.0% |
| Norwegians | 99.9 /100 | #16 | Exceptional 13.0% |
| Bulgarians | 99.9 /100 | #17 | Exceptional 13.0% |
| Cypriots | 99.9 /100 | #18 | Exceptional 13.0% |
| Immigrants | Japan | 99.8 /100 | #19 | Exceptional 13.0% |