Chilean vs Immigrants from Ireland Child Poverty Under the Age of 16
COMPARE
Chilean
Immigrants from Ireland
Child Poverty Under the Age of 16
Child Poverty Under the Age of 16 Comparison
Chileans
Immigrants from Ireland
14.8%
CHILD POVERTY UNDER THE AGE OF 16
94.4/ 100
METRIC RATING
107th/ 347
METRIC RANK
12.7%
CHILD POVERTY UNDER THE AGE OF 16
99.9/ 100
METRIC RATING
12th/ 347
METRIC RANK
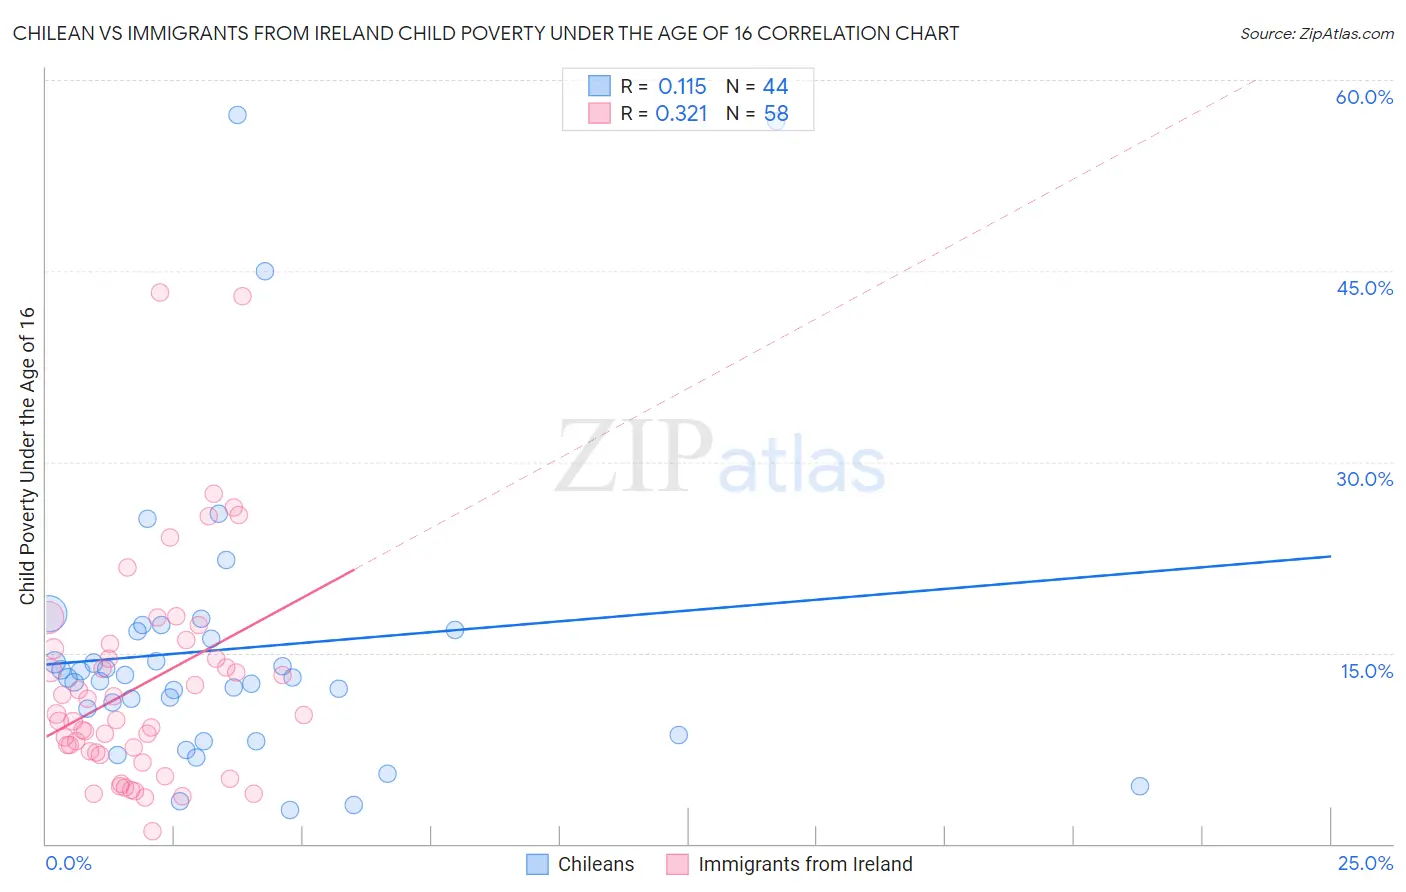
Chilean vs Immigrants from Ireland Child Poverty Under the Age of 16 Correlation Chart
The statistical analysis conducted on geographies consisting of 255,499,348 people shows a poor positive correlation between the proportion of Chileans and poverty level among children under the age of 16 in the United States with a correlation coefficient (R) of 0.115 and weighted average of 14.8%. Similarly, the statistical analysis conducted on geographies consisting of 238,601,869 people shows a mild positive correlation between the proportion of Immigrants from Ireland and poverty level among children under the age of 16 in the United States with a correlation coefficient (R) of 0.321 and weighted average of 12.7%, a difference of 17.1%.
Child Poverty Under the Age of 16 Correlation Summary
| Measurement | Chilean | Immigrants from Ireland |
| Minimum | 2.6% | 0.95% |
| Maximum | 57.2% | 43.3% |
| Range | 54.6% | 42.4% |
| Mean | 15.3% | 12.4% |
| Median | 13.1% | 9.9% |
| Interquartile 25% (IQ1) | 9.6% | 7.2% |
| Interquartile 75% (IQ3) | 16.8% | 15.3% |
| Interquartile Range (IQR) | 7.2% | 8.1% |
| Standard Deviation (Sample) | 11.6% | 8.6% |
| Standard Deviation (Population) | 11.5% | 8.5% |
Similar Demographics by Child Poverty Under the Age of 16
Demographics Similar to Chileans by Child Poverty Under the Age of 16
In terms of child poverty under the age of 16, the demographic groups most similar to Chileans are Serbian (14.8%, a difference of 0.060%), Jordanian (14.8%, a difference of 0.090%), Tlingit-Haida (14.9%, a difference of 0.16%), Basque (14.8%, a difference of 0.19%), and Immigrants from England (14.8%, a difference of 0.30%).
| Demographics | Rating | Rank | Child Poverty Under the Age of 16 |
| Dutch | 95.1 /100 | #100 | Exceptional 14.8% |
| Immigrants | Switzerland | 95.1 /100 | #101 | Exceptional 14.8% |
| Romanians | 95.0 /100 | #102 | Exceptional 14.8% |
| Immigrants | Egypt | 94.9 /100 | #103 | Exceptional 14.8% |
| Immigrants | England | 94.8 /100 | #104 | Exceptional 14.8% |
| Basques | 94.7 /100 | #105 | Exceptional 14.8% |
| Serbians | 94.5 /100 | #106 | Exceptional 14.8% |
| Chileans | 94.4 /100 | #107 | Exceptional 14.8% |
| Jordanians | 94.2 /100 | #108 | Exceptional 14.8% |
| Tlingit-Haida | 94.1 /100 | #109 | Exceptional 14.9% |
| English | 93.5 /100 | #110 | Exceptional 14.9% |
| Immigrants | Denmark | 93.5 /100 | #111 | Exceptional 14.9% |
| Irish | 93.4 /100 | #112 | Exceptional 14.9% |
| Belgians | 93.3 /100 | #113 | Exceptional 14.9% |
| Sri Lankans | 93.2 /100 | #114 | Exceptional 14.9% |
Demographics Similar to Immigrants from Ireland by Child Poverty Under the Age of 16
In terms of child poverty under the age of 16, the demographic groups most similar to Immigrants from Ireland are Burmese (12.8%, a difference of 1.1%), Bhutanese (12.5%, a difference of 1.1%), Immigrants from South Central Asia (12.5%, a difference of 1.1%), Immigrants from Lithuania (12.9%, a difference of 1.9%), and Immigrants from Korea (13.0%, a difference of 2.3%).
| Demographics | Rating | Rank | Child Poverty Under the Age of 16 |
| Chinese | 100.0 /100 | #5 | Exceptional 11.9% |
| Immigrants | Hong Kong | 100.0 /100 | #6 | Exceptional 12.1% |
| Iranians | 100.0 /100 | #7 | Exceptional 12.2% |
| Immigrants | Singapore | 100.0 /100 | #8 | Exceptional 12.4% |
| Immigrants | Iran | 100.0 /100 | #9 | Exceptional 12.4% |
| Immigrants | South Central Asia | 99.9 /100 | #10 | Exceptional 12.5% |
| Bhutanese | 99.9 /100 | #11 | Exceptional 12.5% |
| Immigrants | Ireland | 99.9 /100 | #12 | Exceptional 12.7% |
| Burmese | 99.9 /100 | #13 | Exceptional 12.8% |
| Immigrants | Lithuania | 99.9 /100 | #14 | Exceptional 12.9% |
| Immigrants | Korea | 99.9 /100 | #15 | Exceptional 13.0% |
| Norwegians | 99.9 /100 | #16 | Exceptional 13.0% |
| Bulgarians | 99.9 /100 | #17 | Exceptional 13.0% |
| Cypriots | 99.9 /100 | #18 | Exceptional 13.0% |
| Immigrants | Japan | 99.8 /100 | #19 | Exceptional 13.0% |