Immigrants from El Salvador vs Immigrants from Ireland Child Poverty Under the Age of 16
COMPARE
Immigrants from El Salvador
Immigrants from Ireland
Child Poverty Under the Age of 16
Child Poverty Under the Age of 16 Comparison
Immigrants from El Salvador
Immigrants from Ireland
19.7%
CHILD POVERTY UNDER THE AGE OF 16
0.1/ 100
METRIC RATING
269th/ 347
METRIC RANK
12.7%
CHILD POVERTY UNDER THE AGE OF 16
99.9/ 100
METRIC RATING
12th/ 347
METRIC RANK
Immigrants from El Salvador vs Immigrants from Ireland Child Poverty Under the Age of 16 Correlation Chart
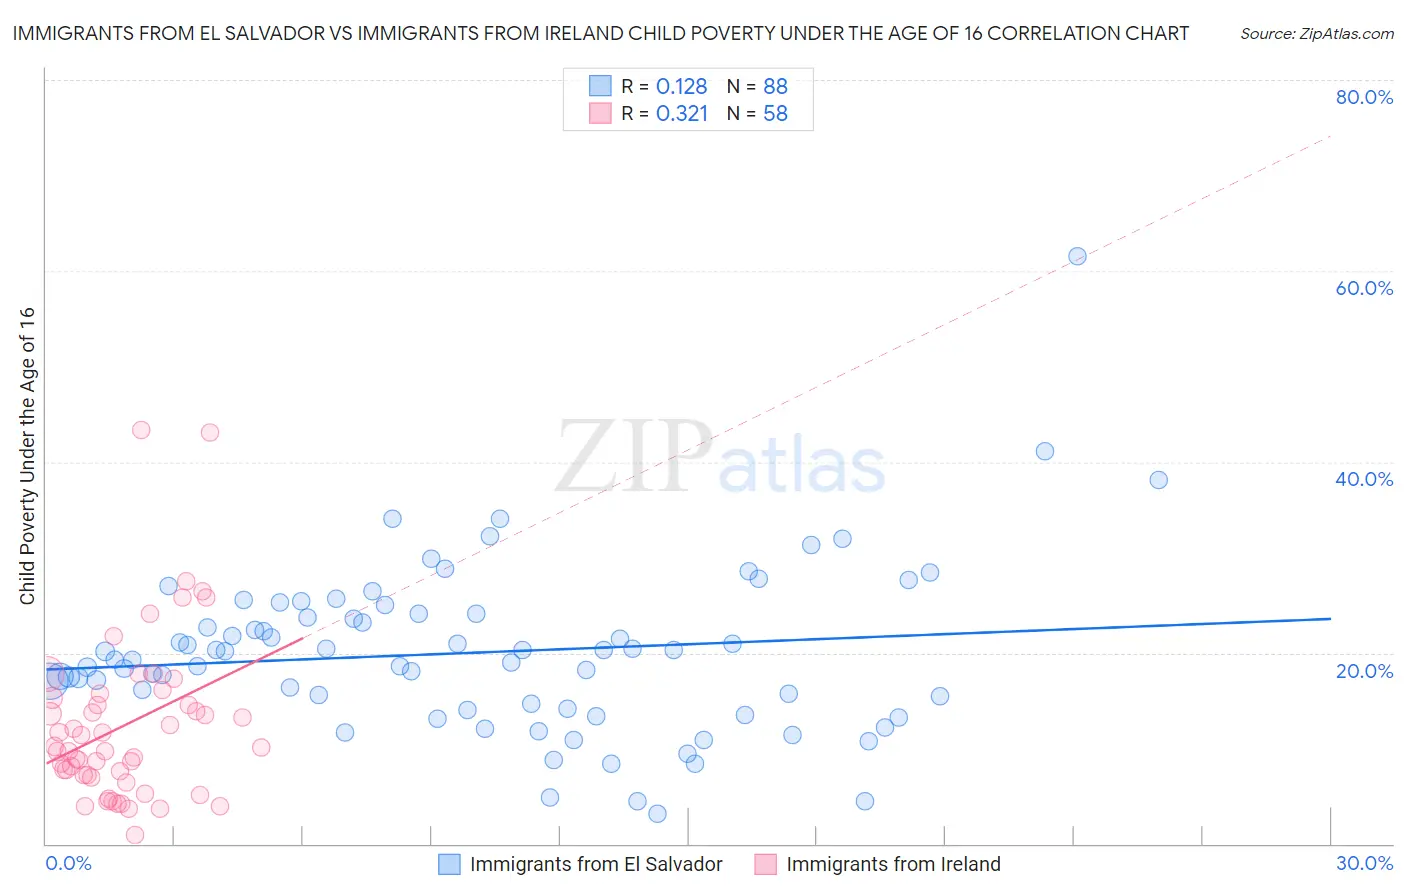
The statistical analysis conducted on geographies consisting of 356,111,542 people shows a poor positive correlation between the proportion of Immigrants from El Salvador and poverty level among children under the age of 16 in the United States with a correlation coefficient (R) of 0.128 and weighted average of 19.7%. Similarly, the statistical analysis conducted on geographies consisting of 238,601,869 people shows a mild positive correlation between the proportion of Immigrants from Ireland and poverty level among children under the age of 16 in the United States with a correlation coefficient (R) of 0.321 and weighted average of 12.7%, a difference of 55.4%.
Child Poverty Under the Age of 16 Correlation Summary
| Measurement | Immigrants from El Salvador | Immigrants from Ireland |
| Minimum | 3.1% | 0.95% |
| Maximum | 61.6% | 43.3% |
| Range | 58.5% | 42.4% |
| Mean | 20.0% | 12.4% |
| Median | 19.7% | 9.9% |
| Interquartile 25% (IQ1) | 14.4% | 7.2% |
| Interquartile 75% (IQ3) | 24.1% | 15.3% |
| Interquartile Range (IQR) | 9.7% | 8.1% |
| Standard Deviation (Sample) | 8.7% | 8.6% |
| Standard Deviation (Population) | 8.7% | 8.5% |
Similar Demographics by Child Poverty Under the Age of 16
Demographics Similar to Immigrants from El Salvador by Child Poverty Under the Age of 16
In terms of child poverty under the age of 16, the demographic groups most similar to Immigrants from El Salvador are Spanish American Indian (19.7%, a difference of 0.020%), Jamaican (19.7%, a difference of 0.060%), Immigrants from Liberia (19.7%, a difference of 0.15%), Immigrants from Bangladesh (19.8%, a difference of 0.46%), and Immigrants from Jamaica (19.8%, a difference of 0.69%).
| Demographics | Rating | Rank | Child Poverty Under the Age of 16 |
| Immigrants | Guyana | 0.1 /100 | #262 | Tragic 19.4% |
| Vietnamese | 0.1 /100 | #263 | Tragic 19.4% |
| Immigrants | Ecuador | 0.1 /100 | #264 | Tragic 19.4% |
| Chickasaw | 0.1 /100 | #265 | Tragic 19.5% |
| Liberians | 0.1 /100 | #266 | Tragic 19.5% |
| Cherokee | 0.1 /100 | #267 | Tragic 19.5% |
| Jamaicans | 0.1 /100 | #268 | Tragic 19.7% |
| Immigrants | El Salvador | 0.1 /100 | #269 | Tragic 19.7% |
| Spanish American Indians | 0.1 /100 | #270 | Tragic 19.7% |
| Immigrants | Liberia | 0.1 /100 | #271 | Tragic 19.7% |
| Immigrants | Bangladesh | 0.1 /100 | #272 | Tragic 19.8% |
| Immigrants | Jamaica | 0.1 /100 | #273 | Tragic 19.8% |
| Immigrants | Cabo Verde | 0.1 /100 | #274 | Tragic 19.9% |
| Immigrants | Barbados | 0.1 /100 | #275 | Tragic 19.9% |
| Belizeans | 0.1 /100 | #276 | Tragic 19.9% |
Demographics Similar to Immigrants from Ireland by Child Poverty Under the Age of 16
In terms of child poverty under the age of 16, the demographic groups most similar to Immigrants from Ireland are Burmese (12.8%, a difference of 1.1%), Bhutanese (12.5%, a difference of 1.1%), Immigrants from South Central Asia (12.5%, a difference of 1.1%), Immigrants from Lithuania (12.9%, a difference of 1.9%), and Immigrants from Korea (13.0%, a difference of 2.3%).
| Demographics | Rating | Rank | Child Poverty Under the Age of 16 |
| Chinese | 100.0 /100 | #5 | Exceptional 11.9% |
| Immigrants | Hong Kong | 100.0 /100 | #6 | Exceptional 12.1% |
| Iranians | 100.0 /100 | #7 | Exceptional 12.2% |
| Immigrants | Singapore | 100.0 /100 | #8 | Exceptional 12.4% |
| Immigrants | Iran | 100.0 /100 | #9 | Exceptional 12.4% |
| Immigrants | South Central Asia | 99.9 /100 | #10 | Exceptional 12.5% |
| Bhutanese | 99.9 /100 | #11 | Exceptional 12.5% |
| Immigrants | Ireland | 99.9 /100 | #12 | Exceptional 12.7% |
| Burmese | 99.9 /100 | #13 | Exceptional 12.8% |
| Immigrants | Lithuania | 99.9 /100 | #14 | Exceptional 12.9% |
| Immigrants | Korea | 99.9 /100 | #15 | Exceptional 13.0% |
| Norwegians | 99.9 /100 | #16 | Exceptional 13.0% |
| Bulgarians | 99.9 /100 | #17 | Exceptional 13.0% |
| Cypriots | 99.9 /100 | #18 | Exceptional 13.0% |
| Immigrants | Japan | 99.8 /100 | #19 | Exceptional 13.0% |