Immigrants from Cambodia vs Immigrants from Turkey Child Poverty Under the Age of 5
COMPARE
Immigrants from Cambodia
Immigrants from Turkey
Child Poverty Under the Age of 5
Child Poverty Under the Age of 5 Comparison
Immigrants from Cambodia
Immigrants from Turkey
18.1%
CHILD POVERTY UNDER THE AGE OF 5
13.7/ 100
METRIC RATING
203rd/ 347
METRIC RANK
15.4%
CHILD POVERTY UNDER THE AGE OF 5
98.3/ 100
METRIC RATING
77th/ 347
METRIC RANK
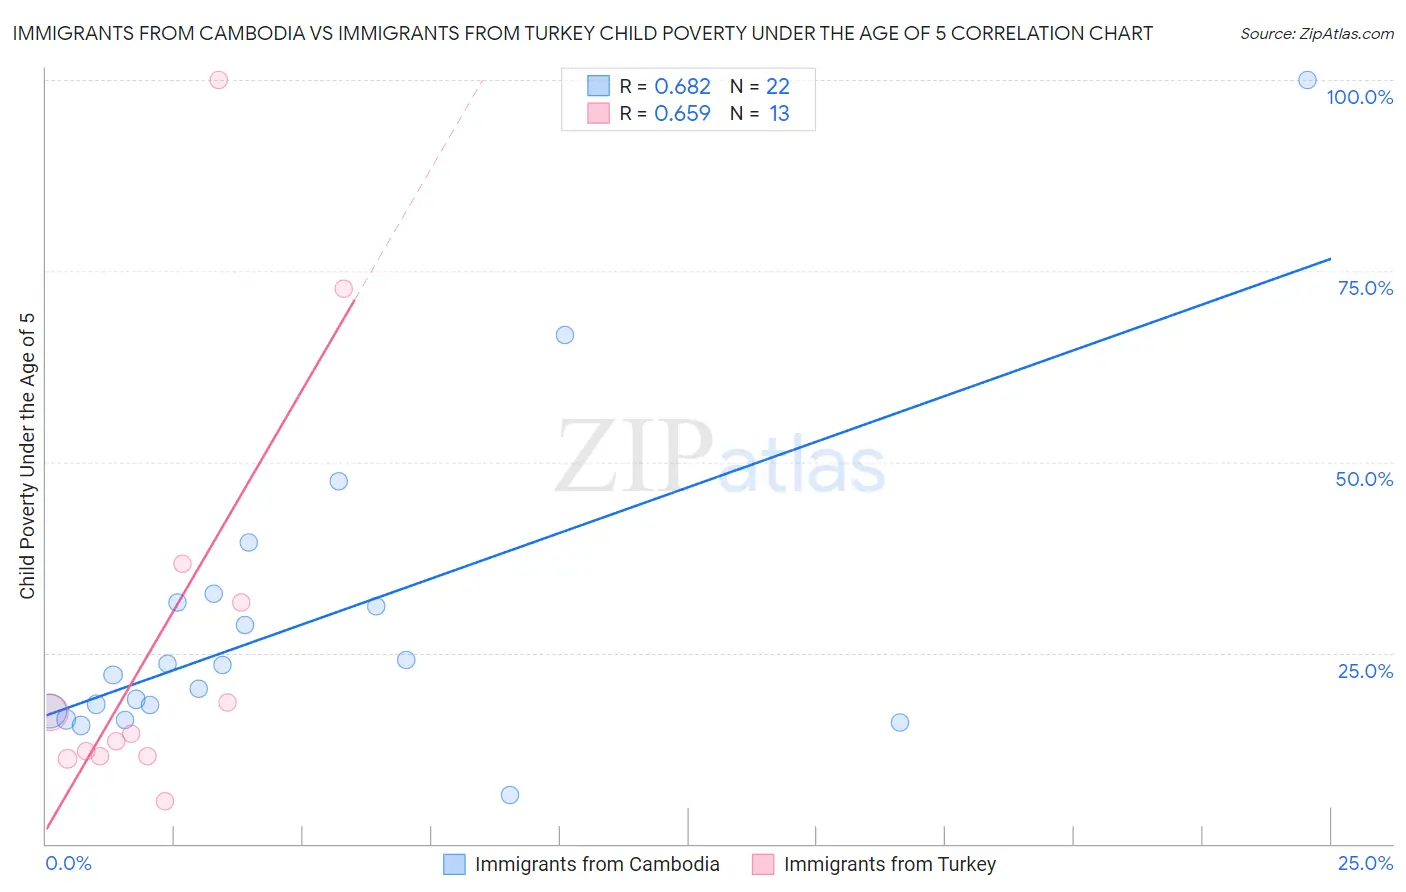
Immigrants from Cambodia vs Immigrants from Turkey Child Poverty Under the Age of 5 Correlation Chart
The statistical analysis conducted on geographies consisting of 201,266,142 people shows a significant positive correlation between the proportion of Immigrants from Cambodia and poverty level among children under the age of 5 in the United States with a correlation coefficient (R) of 0.682 and weighted average of 18.1%. Similarly, the statistical analysis conducted on geographies consisting of 215,409,827 people shows a significant positive correlation between the proportion of Immigrants from Turkey and poverty level among children under the age of 5 in the United States with a correlation coefficient (R) of 0.659 and weighted average of 15.4%, a difference of 17.2%.
Child Poverty Under the Age of 5 Correlation Summary
| Measurement | Immigrants from Cambodia | Immigrants from Turkey |
| Minimum | 6.3% | 5.6% |
| Maximum | 100.0% | 100.0% |
| Range | 93.7% | 94.4% |
| Mean | 28.8% | 27.4% |
| Median | 22.7% | 14.4% |
| Interquartile 25% (IQ1) | 17.4% | 11.5% |
| Interquartile 75% (IQ3) | 31.6% | 34.1% |
| Interquartile Range (IQR) | 14.2% | 22.7% |
| Standard Deviation (Sample) | 20.5% | 28.1% |
| Standard Deviation (Population) | 20.0% | 27.0% |
Similar Demographics by Child Poverty Under the Age of 5
Demographics Similar to Immigrants from Cambodia by Child Poverty Under the Age of 5
In terms of child poverty under the age of 5, the demographic groups most similar to Immigrants from Cambodia are Japanese (18.1%, a difference of 0.020%), Ugandan (18.0%, a difference of 0.040%), Iraqi (18.0%, a difference of 0.050%), Immigrants from Eastern Africa (18.1%, a difference of 0.050%), and Spaniard (18.1%, a difference of 0.19%).
| Demographics | Rating | Rank | Child Poverty Under the Age of 5 |
| Immigrants | Portugal | 22.2 /100 | #196 | Fair 17.8% |
| Immigrants | Kenya | 20.0 /100 | #197 | Fair 17.9% |
| Celtics | 18.3 /100 | #198 | Poor 17.9% |
| Hungarians | 18.3 /100 | #199 | Poor 17.9% |
| Iraqis | 14.0 /100 | #200 | Poor 18.0% |
| Ugandans | 13.9 /100 | #201 | Poor 18.0% |
| Japanese | 13.8 /100 | #202 | Poor 18.1% |
| Immigrants | Cambodia | 13.7 /100 | #203 | Poor 18.1% |
| Immigrants | Eastern Africa | 13.4 /100 | #204 | Poor 18.1% |
| Spaniards | 12.8 /100 | #205 | Poor 18.1% |
| Whites/Caucasians | 12.6 /100 | #206 | Poor 18.1% |
| Immigrants | Immigrants | 9.9 /100 | #207 | Tragic 18.2% |
| Scotch-Irish | 9.8 /100 | #208 | Tragic 18.2% |
| Spanish | 9.8 /100 | #209 | Tragic 18.2% |
| Panamanians | 9.7 /100 | #210 | Tragic 18.2% |
Demographics Similar to Immigrants from Turkey by Child Poverty Under the Age of 5
In terms of child poverty under the age of 5, the demographic groups most similar to Immigrants from Turkey are Immigrants from Argentina (15.4%, a difference of 0.21%), Croatian (15.4%, a difference of 0.21%), Sri Lankan (15.5%, a difference of 0.33%), Argentinean (15.4%, a difference of 0.36%), and Australian (15.5%, a difference of 0.58%).
| Demographics | Rating | Rank | Child Poverty Under the Age of 5 |
| Immigrants | Belgium | 98.8 /100 | #70 | Exceptional 15.3% |
| Immigrants | Egypt | 98.8 /100 | #71 | Exceptional 15.3% |
| Immigrants | Sweden | 98.8 /100 | #72 | Exceptional 15.3% |
| Immigrants | Ukraine | 98.7 /100 | #73 | Exceptional 15.3% |
| Argentineans | 98.5 /100 | #74 | Exceptional 15.4% |
| Immigrants | Argentina | 98.5 /100 | #75 | Exceptional 15.4% |
| Croatians | 98.5 /100 | #76 | Exceptional 15.4% |
| Immigrants | Turkey | 98.3 /100 | #77 | Exceptional 15.4% |
| Sri Lankans | 98.1 /100 | #78 | Exceptional 15.5% |
| Australians | 98.0 /100 | #79 | Exceptional 15.5% |
| Italians | 97.9 /100 | #80 | Exceptional 15.5% |
| Czechs | 97.8 /100 | #81 | Exceptional 15.5% |
| Immigrants | Italy | 97.7 /100 | #82 | Exceptional 15.6% |
| Chileans | 97.6 /100 | #83 | Exceptional 15.6% |
| Immigrants | Netherlands | 97.6 /100 | #84 | Exceptional 15.6% |