Immigrants from Morocco vs Immigrants from Turkey Child Poverty Under the Age of 5
COMPARE
Immigrants from Morocco
Immigrants from Turkey
Child Poverty Under the Age of 5
Child Poverty Under the Age of 5 Comparison
Immigrants from Morocco
Immigrants from Turkey
17.1%
CHILD POVERTY UNDER THE AGE OF 5
58.9/ 100
METRIC RATING
171st/ 347
METRIC RANK
15.4%
CHILD POVERTY UNDER THE AGE OF 5
98.3/ 100
METRIC RATING
77th/ 347
METRIC RANK
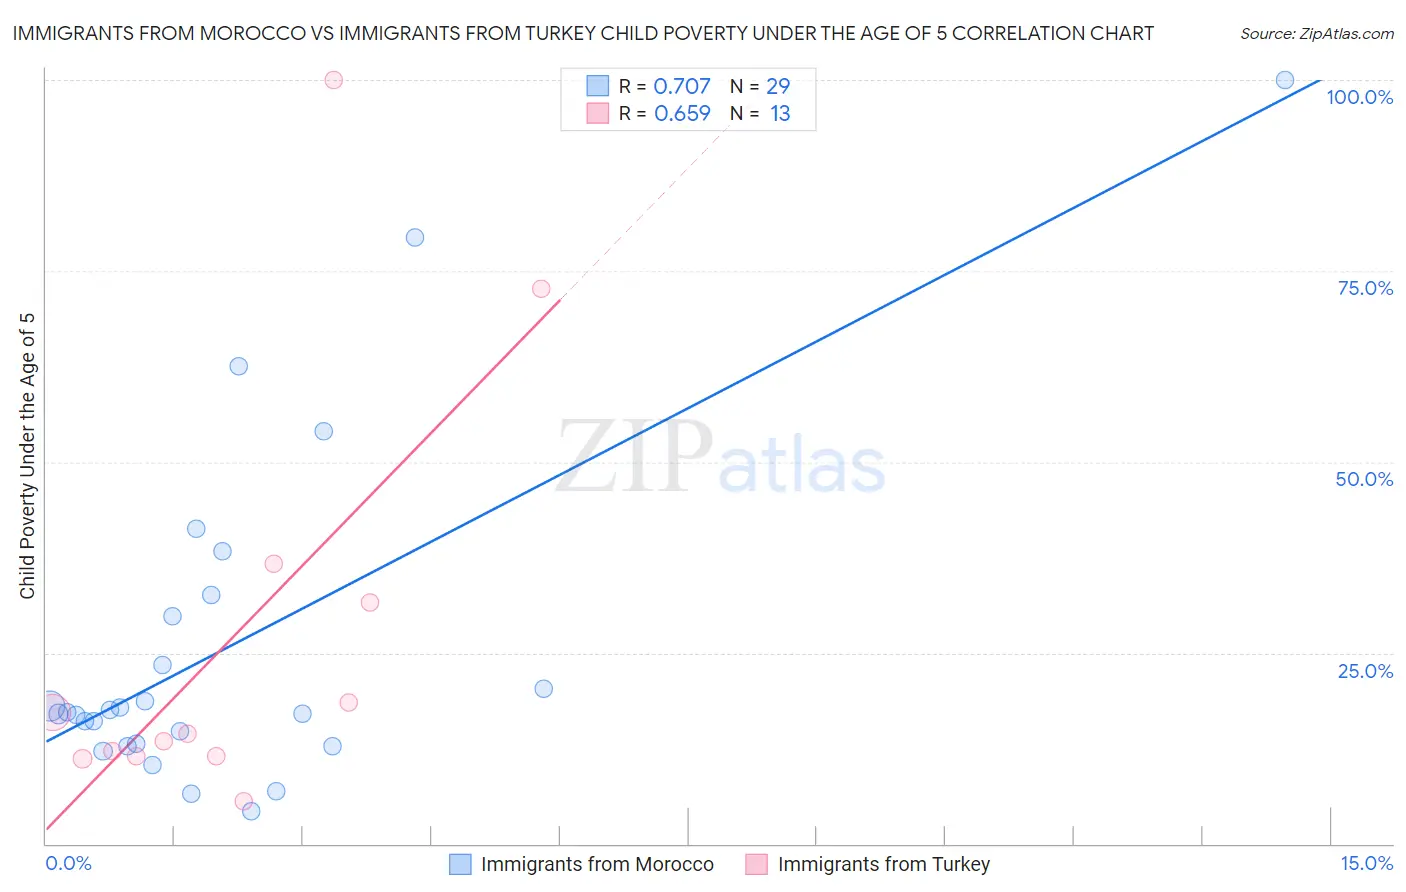
Immigrants from Morocco vs Immigrants from Turkey Child Poverty Under the Age of 5 Correlation Chart
The statistical analysis conducted on geographies consisting of 175,526,639 people shows a strong positive correlation between the proportion of Immigrants from Morocco and poverty level among children under the age of 5 in the United States with a correlation coefficient (R) of 0.707 and weighted average of 17.1%. Similarly, the statistical analysis conducted on geographies consisting of 215,409,827 people shows a significant positive correlation between the proportion of Immigrants from Turkey and poverty level among children under the age of 5 in the United States with a correlation coefficient (R) of 0.659 and weighted average of 15.4%, a difference of 10.8%.
Child Poverty Under the Age of 5 Correlation Summary
| Measurement | Immigrants from Morocco | Immigrants from Turkey |
| Minimum | 4.3% | 5.6% |
| Maximum | 100.0% | 100.0% |
| Range | 95.7% | 94.4% |
| Mean | 25.8% | 27.4% |
| Median | 17.2% | 14.4% |
| Interquartile 25% (IQ1) | 13.0% | 11.5% |
| Interquartile 75% (IQ3) | 31.2% | 34.1% |
| Interquartile Range (IQR) | 18.2% | 22.7% |
| Standard Deviation (Sample) | 22.4% | 28.1% |
| Standard Deviation (Population) | 22.0% | 27.0% |
Similar Demographics by Child Poverty Under the Age of 5
Demographics Similar to Immigrants from Morocco by Child Poverty Under the Age of 5
In terms of child poverty under the age of 5, the demographic groups most similar to Immigrants from Morocco are Immigrants from Western Asia (17.1%, a difference of 0.030%), Immigrants from South America (17.1%, a difference of 0.12%), Uruguayan (17.0%, a difference of 0.17%), Immigrants from Uzbekistan (17.0%, a difference of 0.33%), and Yugoslavian (17.2%, a difference of 0.51%).
| Demographics | Rating | Rank | Child Poverty Under the Age of 5 |
| Immigrants | Oceania | 67.6 /100 | #164 | Good 16.9% |
| Immigrants | Colombia | 66.9 /100 | #165 | Good 16.9% |
| Slavs | 64.0 /100 | #166 | Good 17.0% |
| Immigrants | Uzbekistan | 62.0 /100 | #167 | Good 17.0% |
| Uruguayans | 60.5 /100 | #168 | Good 17.0% |
| Immigrants | South America | 60.0 /100 | #169 | Good 17.1% |
| Immigrants | Western Asia | 59.2 /100 | #170 | Average 17.1% |
| Immigrants | Morocco | 58.9 /100 | #171 | Average 17.1% |
| Yugoslavians | 54.1 /100 | #172 | Average 17.2% |
| Welsh | 54.0 /100 | #173 | Average 17.2% |
| Immigrants | Saudi Arabia | 50.0 /100 | #174 | Average 17.2% |
| Immigrants | Lebanon | 47.6 /100 | #175 | Average 17.3% |
| Immigrants | Iraq | 45.2 /100 | #176 | Average 17.3% |
| Immigrants | Sierra Leone | 43.6 /100 | #177 | Average 17.3% |
| Immigrants | Cameroon | 42.7 /100 | #178 | Average 17.4% |
Demographics Similar to Immigrants from Turkey by Child Poverty Under the Age of 5
In terms of child poverty under the age of 5, the demographic groups most similar to Immigrants from Turkey are Immigrants from Argentina (15.4%, a difference of 0.21%), Croatian (15.4%, a difference of 0.21%), Sri Lankan (15.5%, a difference of 0.33%), Argentinean (15.4%, a difference of 0.36%), and Australian (15.5%, a difference of 0.58%).
| Demographics | Rating | Rank | Child Poverty Under the Age of 5 |
| Immigrants | Belgium | 98.8 /100 | #70 | Exceptional 15.3% |
| Immigrants | Egypt | 98.8 /100 | #71 | Exceptional 15.3% |
| Immigrants | Sweden | 98.8 /100 | #72 | Exceptional 15.3% |
| Immigrants | Ukraine | 98.7 /100 | #73 | Exceptional 15.3% |
| Argentineans | 98.5 /100 | #74 | Exceptional 15.4% |
| Immigrants | Argentina | 98.5 /100 | #75 | Exceptional 15.4% |
| Croatians | 98.5 /100 | #76 | Exceptional 15.4% |
| Immigrants | Turkey | 98.3 /100 | #77 | Exceptional 15.4% |
| Sri Lankans | 98.1 /100 | #78 | Exceptional 15.5% |
| Australians | 98.0 /100 | #79 | Exceptional 15.5% |
| Italians | 97.9 /100 | #80 | Exceptional 15.5% |
| Czechs | 97.8 /100 | #81 | Exceptional 15.5% |
| Immigrants | Italy | 97.7 /100 | #82 | Exceptional 15.6% |
| Chileans | 97.6 /100 | #83 | Exceptional 15.6% |
| Immigrants | Netherlands | 97.6 /100 | #84 | Exceptional 15.6% |