Trinidadian and Tobagonian vs Immigrants from England Seniors Poverty Over the Age of 75
COMPARE
Trinidadian and Tobagonian
Immigrants from England
Seniors Poverty Over the Age of 75
Seniors Poverty Over the Age of 75 Comparison
Trinidadians and Tobagonians
Immigrants from England
15.9%
SENIORS POVERTY OVER THE AGE OF 75
0.0/ 100
METRIC RATING
311th/ 347
METRIC RANK
11.2%
SENIORS POVERTY OVER THE AGE OF 75
98.4/ 100
METRIC RATING
53rd/ 347
METRIC RANK
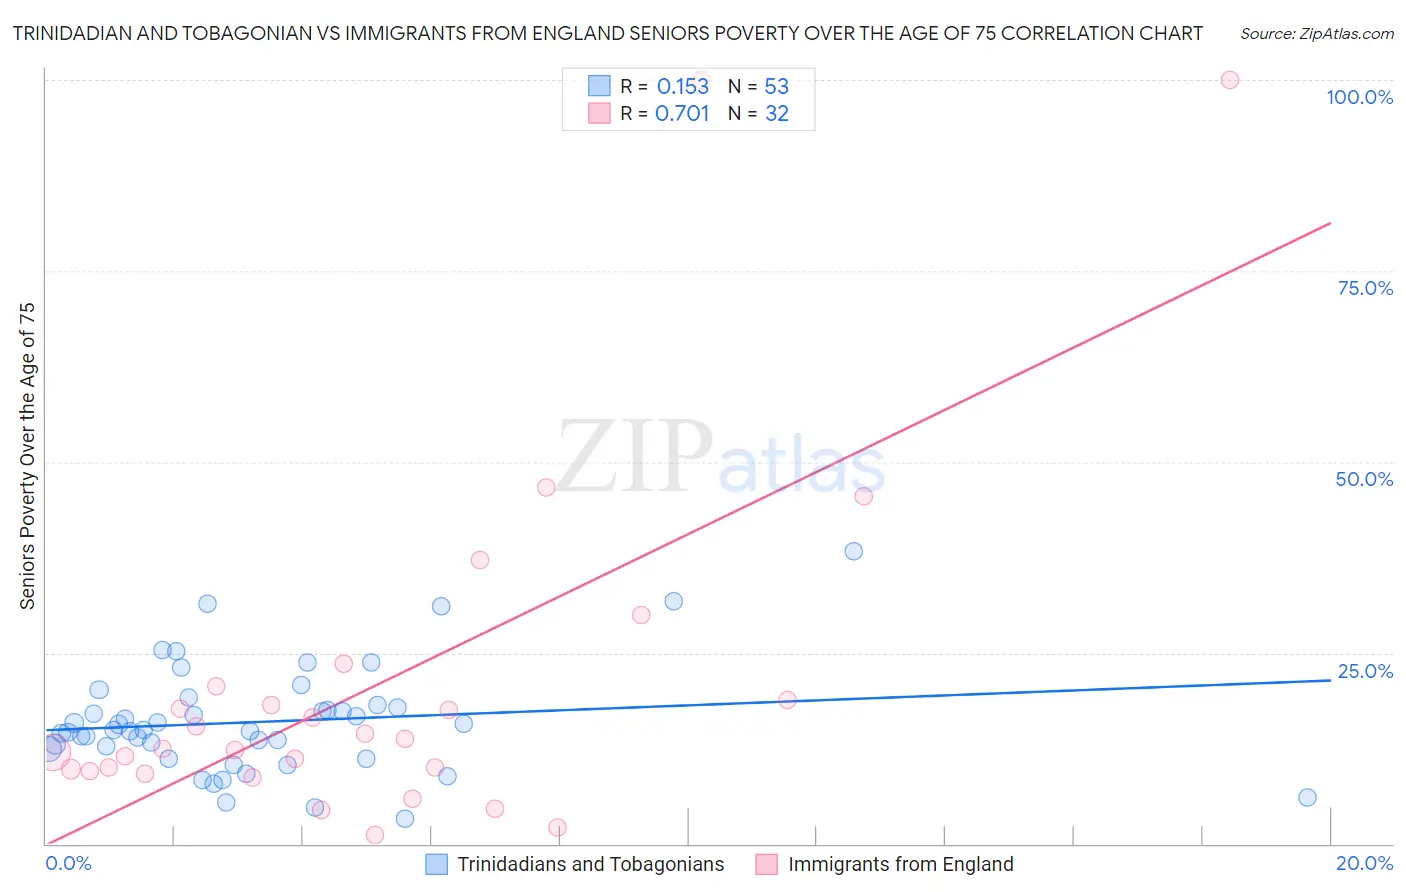
Trinidadian and Tobagonian vs Immigrants from England Seniors Poverty Over the Age of 75 Correlation Chart
The statistical analysis conducted on geographies consisting of 218,354,994 people shows a poor positive correlation between the proportion of Trinidadians and Tobagonians and poverty level among seniors over the age of 75 in the United States with a correlation coefficient (R) of 0.153 and weighted average of 15.9%. Similarly, the statistical analysis conducted on geographies consisting of 387,454,301 people shows a strong positive correlation between the proportion of Immigrants from England and poverty level among seniors over the age of 75 in the United States with a correlation coefficient (R) of 0.701 and weighted average of 11.2%, a difference of 42.2%.
Seniors Poverty Over the Age of 75 Correlation Summary
| Measurement | Trinidadian and Tobagonian | Immigrants from England |
| Minimum | 3.2% | 1.1% |
| Maximum | 38.3% | 100.0% |
| Range | 35.1% | 98.9% |
| Mean | 16.0% | 20.9% |
| Median | 14.9% | 13.1% |
| Interquartile 25% (IQ1) | 11.8% | 9.7% |
| Interquartile 75% (IQ3) | 18.0% | 19.7% |
| Interquartile Range (IQR) | 6.2% | 10.0% |
| Standard Deviation (Sample) | 7.0% | 23.4% |
| Standard Deviation (Population) | 7.0% | 23.1% |
Similar Demographics by Seniors Poverty Over the Age of 75
Demographics Similar to Trinidadians and Tobagonians by Seniors Poverty Over the Age of 75
In terms of seniors poverty over the age of 75, the demographic groups most similar to Trinidadians and Tobagonians are Vietnamese (15.9%, a difference of 0.10%), Yup'ik (15.8%, a difference of 0.20%), Crow (15.9%, a difference of 0.41%), Immigrants from Bangladesh (15.8%, a difference of 0.50%), and Immigrants from West Indies (15.8%, a difference of 0.55%).
| Demographics | Rating | Rank | Seniors Poverty Over the Age of 75 |
| Immigrants | Trinidad and Tobago | 0.0 /100 | #304 | Tragic 15.7% |
| Ecuadorians | 0.0 /100 | #305 | Tragic 15.7% |
| Hispanics or Latinos | 0.0 /100 | #306 | Tragic 15.8% |
| Immigrants | West Indies | 0.0 /100 | #307 | Tragic 15.8% |
| Immigrants | Bangladesh | 0.0 /100 | #308 | Tragic 15.8% |
| Yup'ik | 0.0 /100 | #309 | Tragic 15.8% |
| Vietnamese | 0.0 /100 | #310 | Tragic 15.9% |
| Trinidadians and Tobagonians | 0.0 /100 | #311 | Tragic 15.9% |
| Crow | 0.0 /100 | #312 | Tragic 15.9% |
| Barbadians | 0.0 /100 | #313 | Tragic 16.0% |
| Tsimshian | 0.0 /100 | #314 | Tragic 16.1% |
| Guyanese | 0.0 /100 | #315 | Tragic 16.1% |
| Immigrants | Ecuador | 0.0 /100 | #316 | Tragic 16.1% |
| Immigrants | Guyana | 0.0 /100 | #317 | Tragic 16.2% |
| Houma | 0.0 /100 | #318 | Tragic 16.2% |
Demographics Similar to Immigrants from England by Seniors Poverty Over the Age of 75
In terms of seniors poverty over the age of 75, the demographic groups most similar to Immigrants from England are Zimbabwean (11.2%, a difference of 0.070%), Immigrants from North Macedonia (11.1%, a difference of 0.22%), Serbian (11.1%, a difference of 0.25%), Afghan (11.2%, a difference of 0.32%), and Samoan (11.1%, a difference of 0.36%).
| Demographics | Rating | Rank | Seniors Poverty Over the Age of 75 |
| Greeks | 99.0 /100 | #46 | Exceptional 11.1% |
| Hawaiians | 98.8 /100 | #47 | Exceptional 11.1% |
| French | 98.7 /100 | #48 | Exceptional 11.1% |
| Samoans | 98.7 /100 | #49 | Exceptional 11.1% |
| Serbians | 98.6 /100 | #50 | Exceptional 11.1% |
| Immigrants | North Macedonia | 98.6 /100 | #51 | Exceptional 11.1% |
| Zimbabweans | 98.5 /100 | #52 | Exceptional 11.2% |
| Immigrants | England | 98.4 /100 | #53 | Exceptional 11.2% |
| Afghans | 98.2 /100 | #54 | Exceptional 11.2% |
| Hungarians | 98.1 /100 | #55 | Exceptional 11.2% |
| Slavs | 98.1 /100 | #56 | Exceptional 11.2% |
| Immigrants | Canada | 97.9 /100 | #57 | Exceptional 11.2% |
| Yugoslavians | 97.9 /100 | #58 | Exceptional 11.2% |
| Immigrants | Netherlands | 97.8 /100 | #59 | Exceptional 11.2% |
| Eastern Europeans | 97.7 /100 | #60 | Exceptional 11.3% |