Trinidadian and Tobagonian vs Yakama Seniors Poverty Over the Age of 75
COMPARE
Trinidadian and Tobagonian
Yakama
Seniors Poverty Over the Age of 75
Seniors Poverty Over the Age of 75 Comparison
Trinidadians and Tobagonians
Yakama
15.9%
SENIORS POVERTY OVER THE AGE OF 75
0.0/ 100
METRIC RATING
311th/ 347
METRIC RANK
18.3%
SENIORS POVERTY OVER THE AGE OF 75
0.0/ 100
METRIC RATING
337th/ 347
METRIC RANK
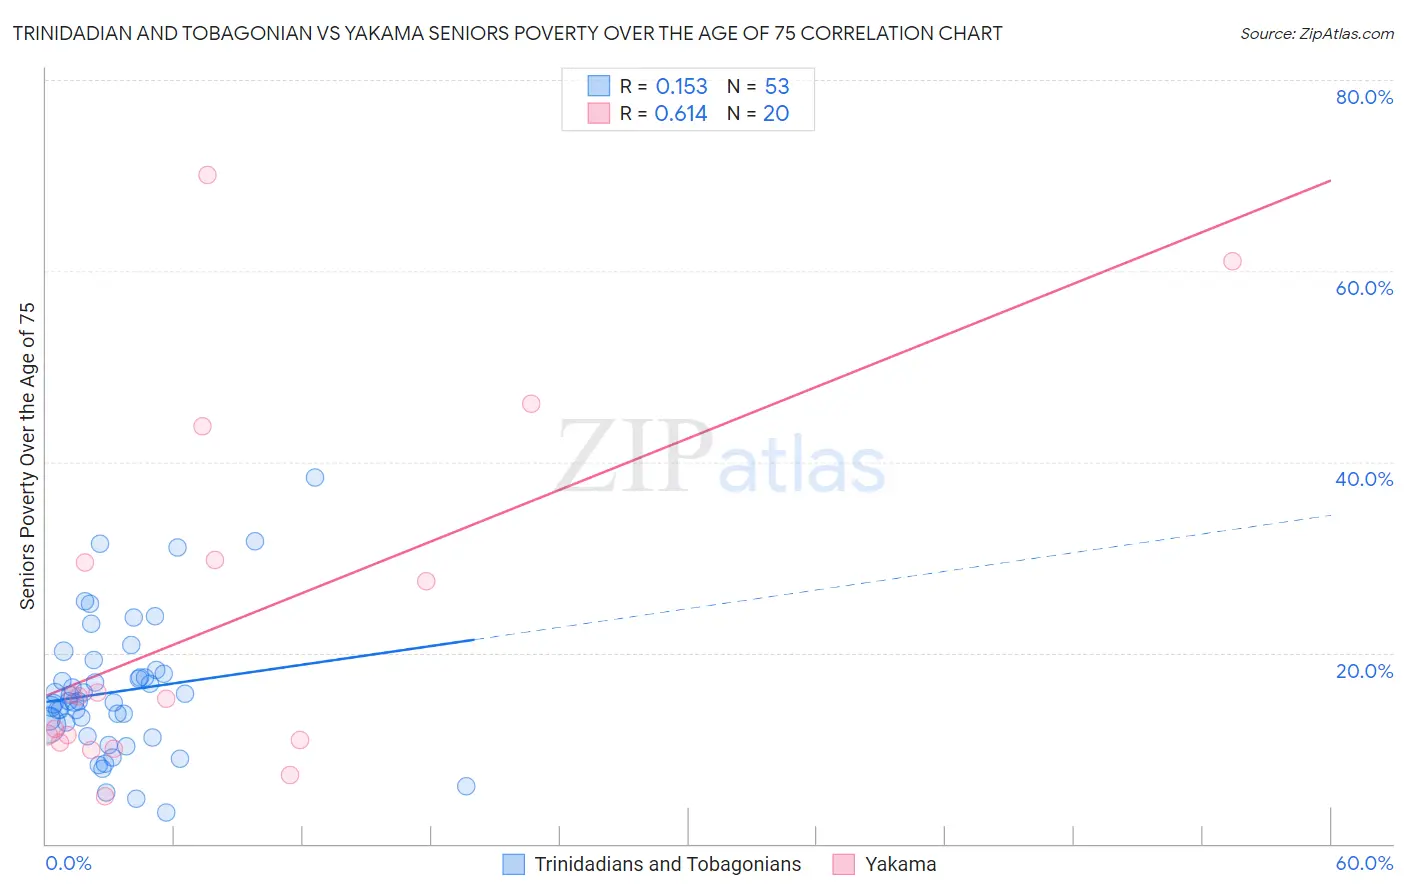
Trinidadian and Tobagonian vs Yakama Seniors Poverty Over the Age of 75 Correlation Chart
The statistical analysis conducted on geographies consisting of 218,354,994 people shows a poor positive correlation between the proportion of Trinidadians and Tobagonians and poverty level among seniors over the age of 75 in the United States with a correlation coefficient (R) of 0.153 and weighted average of 15.9%. Similarly, the statistical analysis conducted on geographies consisting of 19,834,385 people shows a significant positive correlation between the proportion of Yakama and poverty level among seniors over the age of 75 in the United States with a correlation coefficient (R) of 0.614 and weighted average of 18.3%, a difference of 15.4%.
Seniors Poverty Over the Age of 75 Correlation Summary
| Measurement | Trinidadian and Tobagonian | Yakama |
| Minimum | 3.2% | 5.0% |
| Maximum | 38.3% | 70.0% |
| Range | 35.1% | 65.0% |
| Mean | 16.0% | 22.9% |
| Median | 14.9% | 15.3% |
| Interquartile 25% (IQ1) | 11.8% | 10.8% |
| Interquartile 75% (IQ3) | 18.0% | 29.6% |
| Interquartile Range (IQR) | 6.2% | 18.8% |
| Standard Deviation (Sample) | 7.0% | 18.6% |
| Standard Deviation (Population) | 7.0% | 18.1% |
Similar Demographics by Seniors Poverty Over the Age of 75
Demographics Similar to Trinidadians and Tobagonians by Seniors Poverty Over the Age of 75
In terms of seniors poverty over the age of 75, the demographic groups most similar to Trinidadians and Tobagonians are Vietnamese (15.9%, a difference of 0.10%), Yup'ik (15.8%, a difference of 0.20%), Crow (15.9%, a difference of 0.41%), Immigrants from Bangladesh (15.8%, a difference of 0.50%), and Immigrants from West Indies (15.8%, a difference of 0.55%).
| Demographics | Rating | Rank | Seniors Poverty Over the Age of 75 |
| Immigrants | Trinidad and Tobago | 0.0 /100 | #304 | Tragic 15.7% |
| Ecuadorians | 0.0 /100 | #305 | Tragic 15.7% |
| Hispanics or Latinos | 0.0 /100 | #306 | Tragic 15.8% |
| Immigrants | West Indies | 0.0 /100 | #307 | Tragic 15.8% |
| Immigrants | Bangladesh | 0.0 /100 | #308 | Tragic 15.8% |
| Yup'ik | 0.0 /100 | #309 | Tragic 15.8% |
| Vietnamese | 0.0 /100 | #310 | Tragic 15.9% |
| Trinidadians and Tobagonians | 0.0 /100 | #311 | Tragic 15.9% |
| Crow | 0.0 /100 | #312 | Tragic 15.9% |
| Barbadians | 0.0 /100 | #313 | Tragic 16.0% |
| Tsimshian | 0.0 /100 | #314 | Tragic 16.1% |
| Guyanese | 0.0 /100 | #315 | Tragic 16.1% |
| Immigrants | Ecuador | 0.0 /100 | #316 | Tragic 16.1% |
| Immigrants | Guyana | 0.0 /100 | #317 | Tragic 16.2% |
| Houma | 0.0 /100 | #318 | Tragic 16.2% |
Demographics Similar to Yakama by Seniors Poverty Over the Age of 75
In terms of seniors poverty over the age of 75, the demographic groups most similar to Yakama are Immigrants from Caribbean (18.2%, a difference of 0.40%), Immigrants from Cabo Verde (18.5%, a difference of 0.97%), Cuban (18.0%, a difference of 2.1%), Immigrants from Grenada (17.8%, a difference of 2.6%), and Hopi (18.9%, a difference of 2.9%).
| Demographics | Rating | Rank | Seniors Poverty Over the Age of 75 |
| British West Indians | 0.0 /100 | #330 | Tragic 17.4% |
| Immigrants | Armenia | 0.0 /100 | #331 | Tragic 17.5% |
| Immigrants | St. Vincent and the Grenadines | 0.0 /100 | #332 | Tragic 17.5% |
| Immigrants | Nicaragua | 0.0 /100 | #333 | Tragic 17.6% |
| Immigrants | Grenada | 0.0 /100 | #334 | Tragic 17.8% |
| Cubans | 0.0 /100 | #335 | Tragic 18.0% |
| Immigrants | Caribbean | 0.0 /100 | #336 | Tragic 18.2% |
| Yakama | 0.0 /100 | #337 | Tragic 18.3% |
| Immigrants | Cabo Verde | 0.0 /100 | #338 | Tragic 18.5% |
| Hopi | 0.0 /100 | #339 | Tragic 18.9% |
| Tohono O'odham | 0.0 /100 | #340 | Tragic 19.1% |
| Navajo | 0.0 /100 | #341 | Tragic 19.4% |
| Dominicans | 0.0 /100 | #342 | Tragic 19.6% |
| Lumbee | 0.0 /100 | #343 | Tragic 19.7% |
| Immigrants | Cuba | 0.0 /100 | #344 | Tragic 19.9% |