Immigrants from Netherlands vs Immigrants from Canada Single Male Poverty
COMPARE
Immigrants from Netherlands
Immigrants from Canada
Single Male Poverty
Single Male Poverty Comparison
Immigrants from Netherlands
Immigrants from Canada
12.5%
SINGLE MALE POVERTY
86.2/ 100
METRIC RATING
127th/ 347
METRIC RANK
12.8%
SINGLE MALE POVERTY
44.8/ 100
METRIC RATING
177th/ 347
METRIC RANK
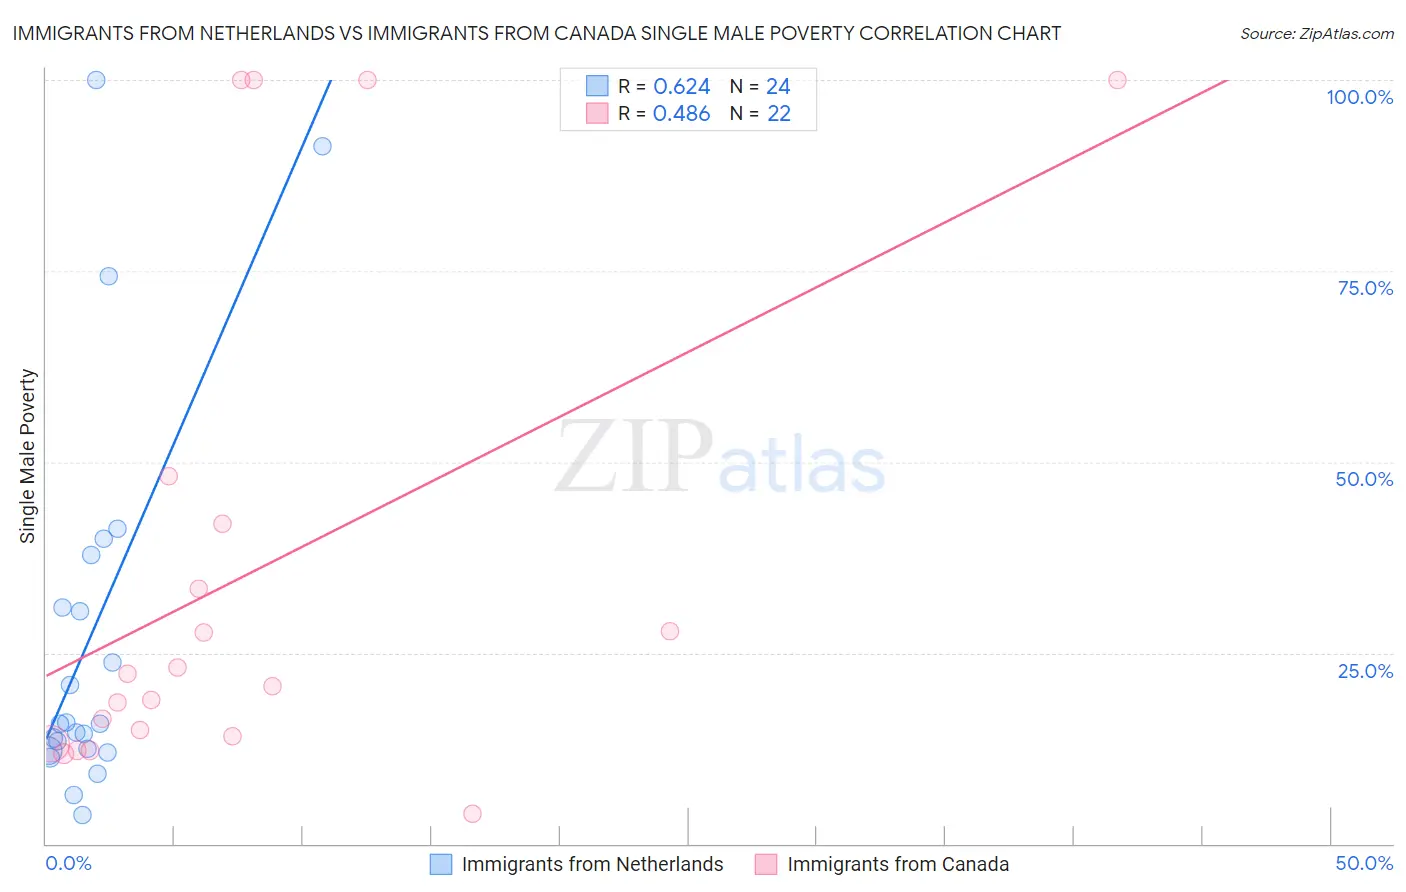
Immigrants from Netherlands vs Immigrants from Canada Single Male Poverty Correlation Chart
The statistical analysis conducted on geographies consisting of 216,285,170 people shows a significant positive correlation between the proportion of Immigrants from Netherlands and poverty level among single males in the United States with a correlation coefficient (R) of 0.624 and weighted average of 12.5%. Similarly, the statistical analysis conducted on geographies consisting of 395,473,582 people shows a moderate positive correlation between the proportion of Immigrants from Canada and poverty level among single males in the United States with a correlation coefficient (R) of 0.486 and weighted average of 12.8%, a difference of 2.8%.
Single Male Poverty Correlation Summary
| Measurement | Immigrants from Netherlands | Immigrants from Canada |
| Minimum | 3.8% | 4.0% |
| Maximum | 100.0% | 100.0% |
| Range | 96.2% | 96.0% |
| Mean | 27.6% | 35.5% |
| Median | 15.7% | 21.5% |
| Interquartile 25% (IQ1) | 12.3% | 14.1% |
| Interquartile 75% (IQ3) | 34.4% | 41.9% |
| Interquartile Range (IQR) | 22.1% | 27.8% |
| Standard Deviation (Sample) | 26.0% | 32.7% |
| Standard Deviation (Population) | 25.4% | 32.0% |
Similar Demographics by Single Male Poverty
Demographics Similar to Immigrants from Netherlands by Single Male Poverty
In terms of single male poverty, the demographic groups most similar to Immigrants from Netherlands are Romanian (12.5%, a difference of 0.010%), Ecuadorian (12.5%, a difference of 0.040%), Immigrants from Sierra Leone (12.5%, a difference of 0.080%), Immigrants from Jordan (12.5%, a difference of 0.10%), and Russian (12.5%, a difference of 0.13%).
| Demographics | Rating | Rank | Single Male Poverty |
| Venezuelans | 89.4 /100 | #120 | Excellent 12.4% |
| Icelanders | 88.2 /100 | #121 | Excellent 12.5% |
| Serbians | 87.9 /100 | #122 | Excellent 12.5% |
| Immigrants | Kenya | 87.6 /100 | #123 | Excellent 12.5% |
| Russians | 87.3 /100 | #124 | Excellent 12.5% |
| Immigrants | Jordan | 87.1 /100 | #125 | Excellent 12.5% |
| Romanians | 86.4 /100 | #126 | Excellent 12.5% |
| Immigrants | Netherlands | 86.2 /100 | #127 | Excellent 12.5% |
| Ecuadorians | 85.9 /100 | #128 | Excellent 12.5% |
| Immigrants | Sierra Leone | 85.5 /100 | #129 | Excellent 12.5% |
| Immigrants | Nicaragua | 84.8 /100 | #130 | Excellent 12.5% |
| Immigrants | Northern Europe | 83.7 /100 | #131 | Excellent 12.5% |
| Salvadorans | 83.7 /100 | #132 | Excellent 12.5% |
| Immigrants | Western Asia | 83.4 /100 | #133 | Excellent 12.5% |
| Immigrants | Ecuador | 82.1 /100 | #134 | Excellent 12.5% |
Demographics Similar to Immigrants from Canada by Single Male Poverty
In terms of single male poverty, the demographic groups most similar to Immigrants from Canada are Immigrants from Switzerland (12.8%, a difference of 0.090%), Syrian (12.8%, a difference of 0.19%), Israeli (12.9%, a difference of 0.20%), Croatian (12.8%, a difference of 0.22%), and Costa Rican (12.8%, a difference of 0.28%).
| Demographics | Rating | Rank | Single Male Poverty |
| Guyanese | 52.0 /100 | #170 | Average 12.8% |
| South Africans | 51.5 /100 | #171 | Average 12.8% |
| Danes | 51.4 /100 | #172 | Average 12.8% |
| Immigrants | St. Vincent and the Grenadines | 50.9 /100 | #173 | Average 12.8% |
| Costa Ricans | 50.0 /100 | #174 | Average 12.8% |
| Croatians | 48.9 /100 | #175 | Average 12.8% |
| Syrians | 48.4 /100 | #176 | Average 12.8% |
| Immigrants | Canada | 44.8 /100 | #177 | Average 12.8% |
| Immigrants | Switzerland | 43.1 /100 | #178 | Average 12.8% |
| Israelis | 41.0 /100 | #179 | Average 12.9% |
| Immigrants | North America | 37.7 /100 | #180 | Fair 12.9% |
| Panamanians | 37.6 /100 | #181 | Fair 12.9% |
| Moroccans | 36.8 /100 | #182 | Fair 12.9% |
| Immigrants | West Indies | 33.0 /100 | #183 | Fair 12.9% |
| Immigrants | Trinidad and Tobago | 32.5 /100 | #184 | Fair 12.9% |