Bahamian vs Immigrants from Canada Single Male Poverty
COMPARE
Bahamian
Immigrants from Canada
Single Male Poverty
Single Male Poverty Comparison
Bahamians
Immigrants from Canada
14.6%
SINGLE MALE POVERTY
0.0/ 100
METRIC RATING
291st/ 347
METRIC RANK
12.8%
SINGLE MALE POVERTY
44.8/ 100
METRIC RATING
177th/ 347
METRIC RANK
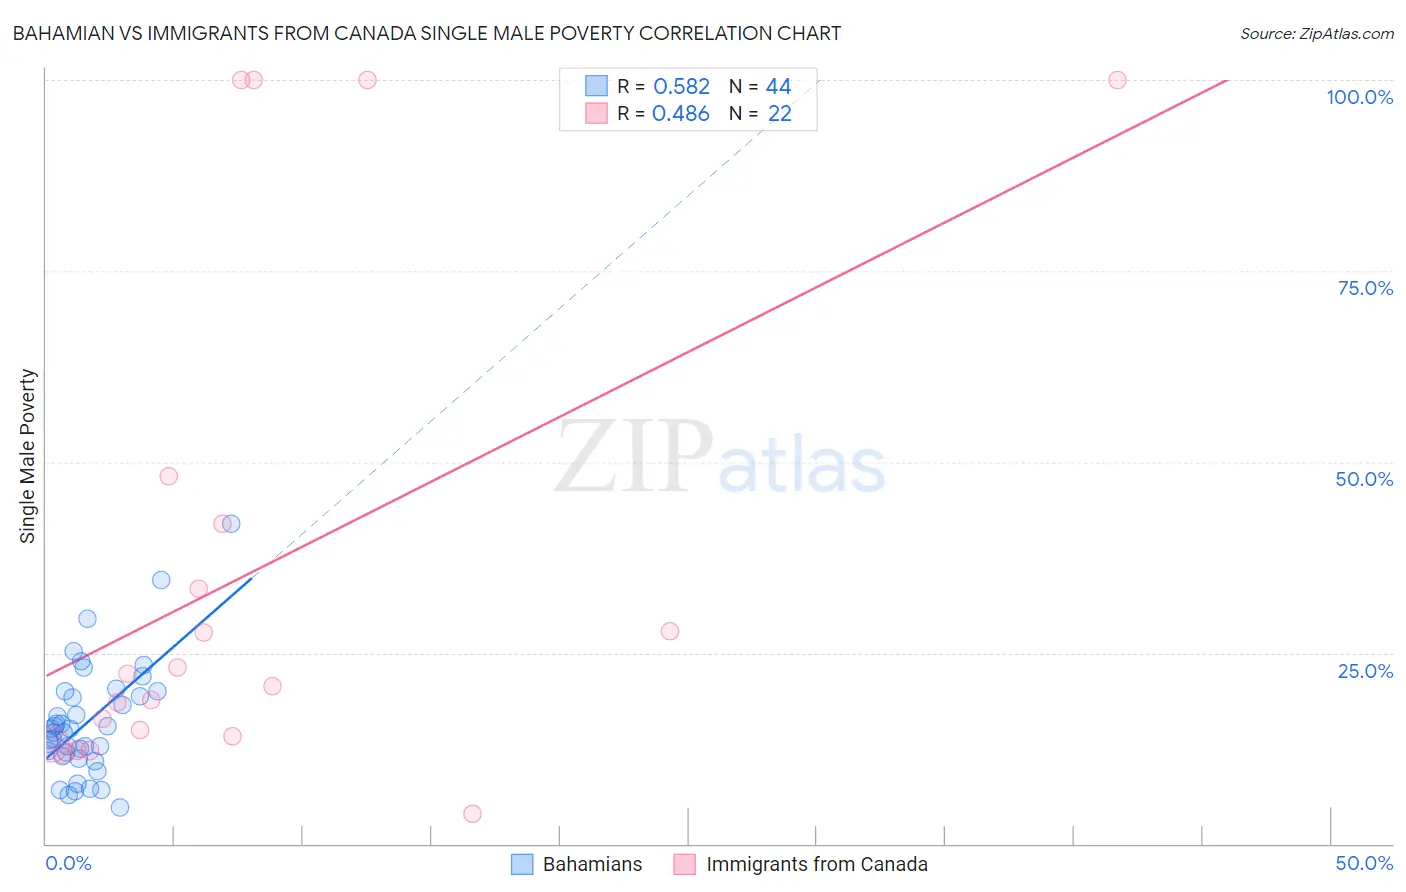
Bahamian vs Immigrants from Canada Single Male Poverty Correlation Chart
The statistical analysis conducted on geographies consisting of 108,151,039 people shows a substantial positive correlation between the proportion of Bahamians and poverty level among single males in the United States with a correlation coefficient (R) of 0.582 and weighted average of 14.6%. Similarly, the statistical analysis conducted on geographies consisting of 395,473,582 people shows a moderate positive correlation between the proportion of Immigrants from Canada and poverty level among single males in the United States with a correlation coefficient (R) of 0.486 and weighted average of 12.8%, a difference of 13.4%.
Single Male Poverty Correlation Summary
| Measurement | Bahamian | Immigrants from Canada |
| Minimum | 4.8% | 4.0% |
| Maximum | 41.8% | 100.0% |
| Range | 37.0% | 96.0% |
| Mean | 15.9% | 35.5% |
| Median | 14.8% | 21.5% |
| Interquartile 25% (IQ1) | 11.7% | 14.1% |
| Interquartile 75% (IQ3) | 19.6% | 41.9% |
| Interquartile Range (IQR) | 7.9% | 27.8% |
| Standard Deviation (Sample) | 7.4% | 32.7% |
| Standard Deviation (Population) | 7.4% | 32.0% |
Similar Demographics by Single Male Poverty
Demographics Similar to Bahamians by Single Male Poverty
In terms of single male poverty, the demographic groups most similar to Bahamians are Nonimmigrants (14.6%, a difference of 0.13%), U.S. Virgin Islander (14.5%, a difference of 0.15%), French Canadian (14.6%, a difference of 0.25%), Immigrants from Dominica (14.5%, a difference of 0.38%), and Ottawa (14.6%, a difference of 0.43%).
| Demographics | Rating | Rank | Single Male Poverty |
| Immigrants | Bahamas | 0.0 /100 | #284 | Tragic 14.4% |
| French | 0.0 /100 | #285 | Tragic 14.4% |
| Celtics | 0.0 /100 | #286 | Tragic 14.5% |
| Iroquois | 0.0 /100 | #287 | Tragic 14.5% |
| Whites/Caucasians | 0.0 /100 | #288 | Tragic 14.5% |
| Immigrants | Dominica | 0.0 /100 | #289 | Tragic 14.5% |
| U.S. Virgin Islanders | 0.0 /100 | #290 | Tragic 14.5% |
| Bahamians | 0.0 /100 | #291 | Tragic 14.6% |
| Immigrants | Nonimmigrants | 0.0 /100 | #292 | Tragic 14.6% |
| French Canadians | 0.0 /100 | #293 | Tragic 14.6% |
| Ottawa | 0.0 /100 | #294 | Tragic 14.6% |
| Scotch-Irish | 0.0 /100 | #295 | Tragic 14.7% |
| Africans | 0.0 /100 | #296 | Tragic 14.7% |
| Immigrants | Dominican Republic | 0.0 /100 | #297 | Tragic 14.8% |
| French American Indians | 0.0 /100 | #298 | Tragic 15.0% |
Demographics Similar to Immigrants from Canada by Single Male Poverty
In terms of single male poverty, the demographic groups most similar to Immigrants from Canada are Immigrants from Switzerland (12.8%, a difference of 0.090%), Syrian (12.8%, a difference of 0.19%), Israeli (12.9%, a difference of 0.20%), Croatian (12.8%, a difference of 0.22%), and Costa Rican (12.8%, a difference of 0.28%).
| Demographics | Rating | Rank | Single Male Poverty |
| Guyanese | 52.0 /100 | #170 | Average 12.8% |
| South Africans | 51.5 /100 | #171 | Average 12.8% |
| Danes | 51.4 /100 | #172 | Average 12.8% |
| Immigrants | St. Vincent and the Grenadines | 50.9 /100 | #173 | Average 12.8% |
| Costa Ricans | 50.0 /100 | #174 | Average 12.8% |
| Croatians | 48.9 /100 | #175 | Average 12.8% |
| Syrians | 48.4 /100 | #176 | Average 12.8% |
| Immigrants | Canada | 44.8 /100 | #177 | Average 12.8% |
| Immigrants | Switzerland | 43.1 /100 | #178 | Average 12.8% |
| Israelis | 41.0 /100 | #179 | Average 12.9% |
| Immigrants | North America | 37.7 /100 | #180 | Fair 12.9% |
| Panamanians | 37.6 /100 | #181 | Fair 12.9% |
| Moroccans | 36.8 /100 | #182 | Fair 12.9% |
| Immigrants | West Indies | 33.0 /100 | #183 | Fair 12.9% |
| Immigrants | Trinidad and Tobago | 32.5 /100 | #184 | Fair 12.9% |