Immigrants from Bahamas vs Cherokee Child Poverty Under the Age of 5
COMPARE
Immigrants from Bahamas
Cherokee
Child Poverty Under the Age of 5
Child Poverty Under the Age of 5 Comparison
Immigrants from Bahamas
Cherokee
22.7%
CHILD POVERTY UNDER THE AGE OF 5
0.0/ 100
METRIC RATING
307th/ 347
METRIC RANK
21.7%
CHILD POVERTY UNDER THE AGE OF 5
0.0/ 100
METRIC RATING
295th/ 347
METRIC RANK
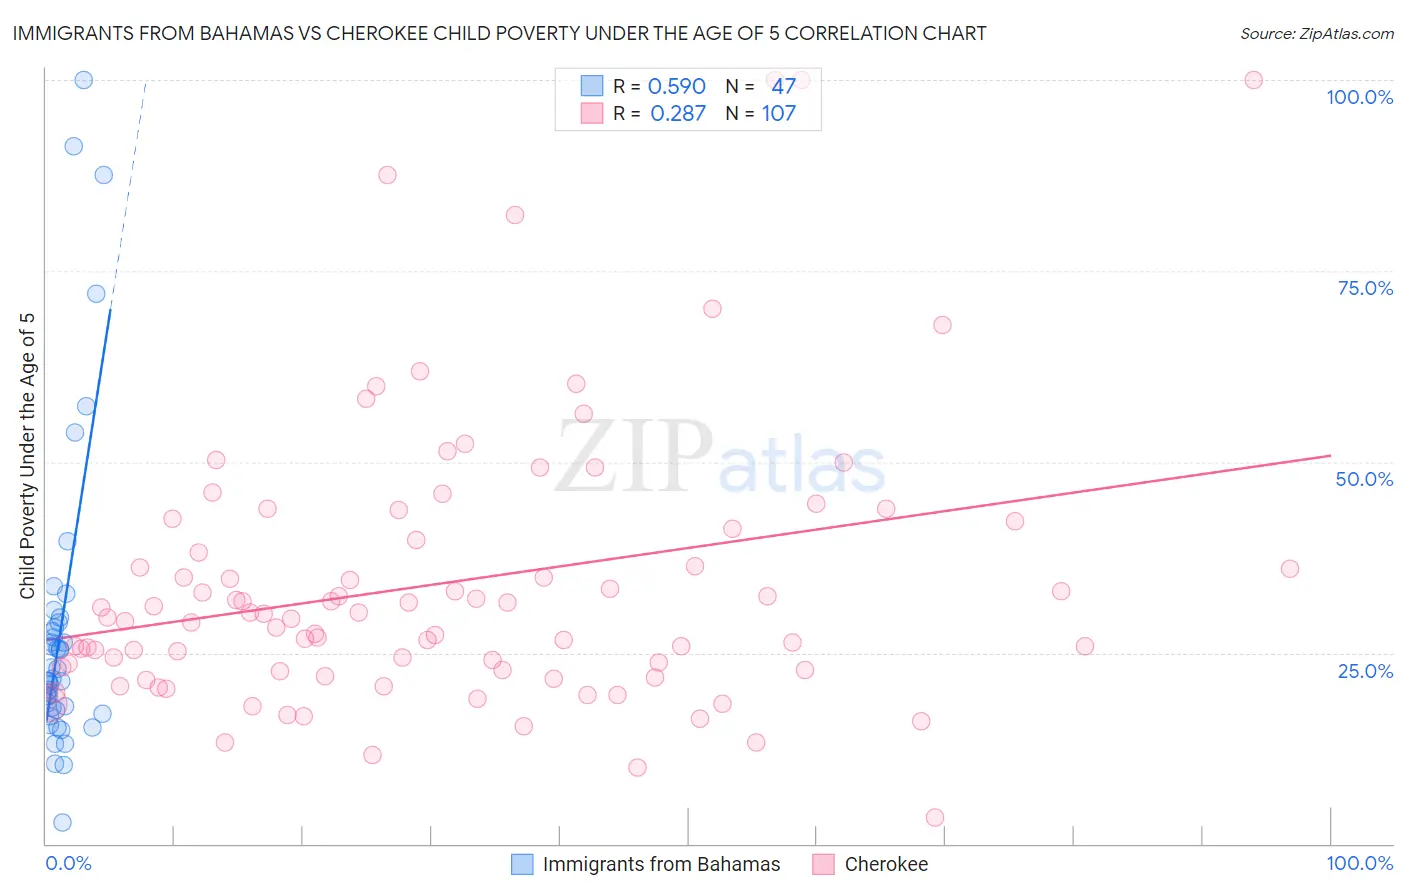
Immigrants from Bahamas vs Cherokee Child Poverty Under the Age of 5 Correlation Chart
The statistical analysis conducted on geographies consisting of 103,726,631 people shows a substantial positive correlation between the proportion of Immigrants from Bahamas and poverty level among children under the age of 5 in the United States with a correlation coefficient (R) of 0.590 and weighted average of 22.7%. Similarly, the statistical analysis conducted on geographies consisting of 472,103,422 people shows a weak positive correlation between the proportion of Cherokee and poverty level among children under the age of 5 in the United States with a correlation coefficient (R) of 0.287 and weighted average of 21.7%, a difference of 4.5%.
Child Poverty Under the Age of 5 Correlation Summary
| Measurement | Immigrants from Bahamas | Cherokee |
| Minimum | 2.7% | 3.5% |
| Maximum | 100.0% | 100.0% |
| Range | 97.3% | 96.5% |
| Mean | 28.6% | 34.1% |
| Median | 21.6% | 29.6% |
| Interquartile 25% (IQ1) | 17.5% | 22.7% |
| Interquartile 75% (IQ3) | 29.0% | 41.2% |
| Interquartile Range (IQR) | 11.5% | 18.4% |
| Standard Deviation (Sample) | 20.8% | 18.4% |
| Standard Deviation (Population) | 20.6% | 18.3% |
Demographics Similar to Immigrants from Bahamas and Cherokee by Child Poverty Under the Age of 5
In terms of child poverty under the age of 5, the demographic groups most similar to Immigrants from Bahamas are Immigrants from Dominica (22.7%, a difference of 0.040%), Houma (22.7%, a difference of 0.18%), African (22.8%, a difference of 0.59%), Seminole (22.8%, a difference of 0.63%), and Indonesian (22.3%, a difference of 1.9%). Similarly, the demographic groups most similar to Cherokee are Yaqui (21.7%, a difference of 0.15%), Hispanic or Latino (21.7%, a difference of 0.17%), Guatemalan (21.6%, a difference of 0.26%), Mexican (21.6%, a difference of 0.40%), and Blackfeet (21.8%, a difference of 0.56%).
| Demographics | Rating | Rank | Child Poverty Under the Age of 5 |
| British West Indians | 0.0 /100 | #291 | Tragic 21.4% |
| Immigrants | Somalia | 0.0 /100 | #292 | Tragic 21.6% |
| Mexicans | 0.0 /100 | #293 | Tragic 21.6% |
| Guatemalans | 0.0 /100 | #294 | Tragic 21.6% |
| Cherokee | 0.0 /100 | #295 | Tragic 21.7% |
| Yaqui | 0.0 /100 | #296 | Tragic 21.7% |
| Hispanics or Latinos | 0.0 /100 | #297 | Tragic 21.7% |
| Blackfeet | 0.0 /100 | #298 | Tragic 21.8% |
| Chickasaw | 0.0 /100 | #299 | Tragic 21.8% |
| Alaskan Athabascans | 0.0 /100 | #300 | Tragic 21.8% |
| Immigrants | Central America | 0.0 /100 | #301 | Tragic 22.0% |
| Iroquois | 0.0 /100 | #302 | Tragic 22.0% |
| Inupiat | 0.0 /100 | #303 | Tragic 22.0% |
| Immigrants | Guatemala | 0.0 /100 | #304 | Tragic 22.0% |
| Immigrants | Mexico | 0.0 /100 | #305 | Tragic 22.2% |
| Indonesians | 0.0 /100 | #306 | Tragic 22.3% |
| Immigrants | Bahamas | 0.0 /100 | #307 | Tragic 22.7% |
| Immigrants | Dominica | 0.0 /100 | #308 | Tragic 22.7% |
| Houma | 0.0 /100 | #309 | Tragic 22.7% |
| Africans | 0.0 /100 | #310 | Tragic 22.8% |
| Seminole | 0.0 /100 | #311 | Tragic 22.8% |