Trinidadian and Tobagonian vs Cambodian Female Poverty Among 18-24 Year Olds
COMPARE
Trinidadian and Tobagonian
Cambodian
Female Poverty Among 18-24 Year Olds
Female Poverty Among 18-24 Year Olds Comparison
Trinidadians and Tobagonians
Cambodians
19.8%
FEMALE POVERTY AMONG 18-24 YEAR OLDS
74.4/ 100
METRIC RATING
159th/ 347
METRIC RANK
19.4%
FEMALE POVERTY AMONG 18-24 YEAR OLDS
94.6/ 100
METRIC RATING
122nd/ 347
METRIC RANK
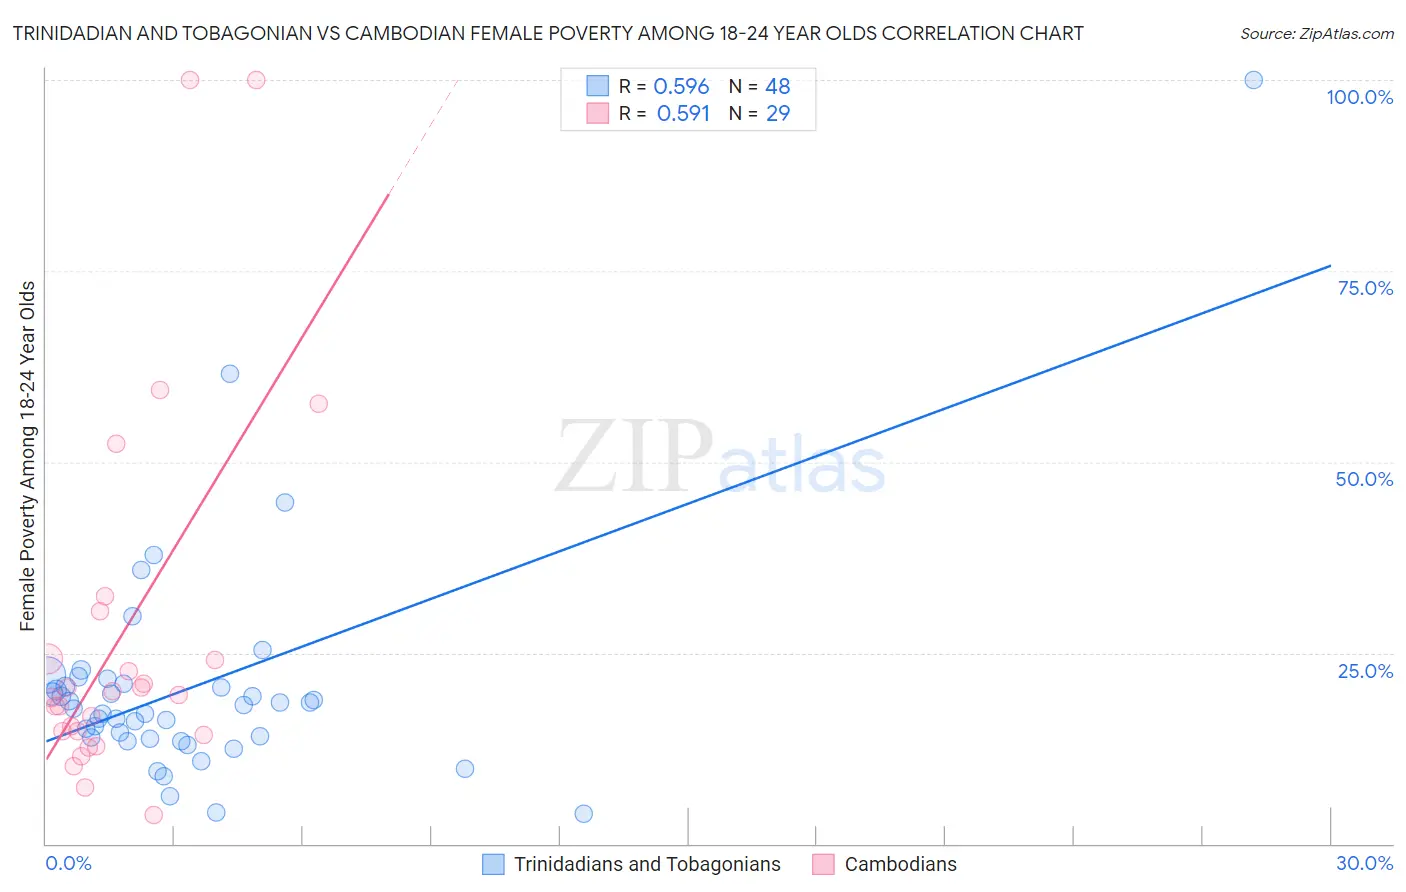
Trinidadian and Tobagonian vs Cambodian Female Poverty Among 18-24 Year Olds Correlation Chart
The statistical analysis conducted on geographies consisting of 216,840,650 people shows a substantial positive correlation between the proportion of Trinidadians and Tobagonians and poverty level among females between the ages 18 and 24 in the United States with a correlation coefficient (R) of 0.596 and weighted average of 19.8%. Similarly, the statistical analysis conducted on geographies consisting of 101,940,154 people shows a substantial positive correlation between the proportion of Cambodians and poverty level among females between the ages 18 and 24 in the United States with a correlation coefficient (R) of 0.591 and weighted average of 19.4%, a difference of 2.3%.
Female Poverty Among 18-24 Year Olds Correlation Summary
| Measurement | Trinidadian and Tobagonian | Cambodian |
| Minimum | 3.9% | 3.8% |
| Maximum | 100.0% | 100.0% |
| Range | 96.1% | 96.2% |
| Mean | 20.5% | 27.4% |
| Median | 17.9% | 19.4% |
| Interquartile 25% (IQ1) | 13.8% | 14.5% |
| Interquartile 75% (IQ3) | 20.7% | 27.4% |
| Interquartile Range (IQR) | 6.9% | 12.8% |
| Standard Deviation (Sample) | 15.3% | 24.2% |
| Standard Deviation (Population) | 15.2% | 23.8% |
Similar Demographics by Female Poverty Among 18-24 Year Olds
Demographics Similar to Trinidadians and Tobagonians by Female Poverty Among 18-24 Year Olds
In terms of female poverty among 18-24 year olds, the demographic groups most similar to Trinidadians and Tobagonians are Pakistani (19.8%, a difference of 0.020%), Immigrants from Belize (19.8%, a difference of 0.020%), Immigrants from Lebanon (19.8%, a difference of 0.060%), Danish (19.8%, a difference of 0.070%), and French Canadian (19.9%, a difference of 0.090%).
| Demographics | Rating | Rank | Female Poverty Among 18-24 Year Olds |
| Yugoslavians | 79.0 /100 | #152 | Good 19.8% |
| Immigrants | Japan | 78.1 /100 | #153 | Good 19.8% |
| Immigrants | Zimbabwe | 76.7 /100 | #154 | Good 19.8% |
| Hungarians | 76.6 /100 | #155 | Good 19.8% |
| Immigrants | Belgium | 76.4 /100 | #156 | Good 19.8% |
| Danes | 75.5 /100 | #157 | Good 19.8% |
| Immigrants | Lebanon | 75.3 /100 | #158 | Good 19.8% |
| Trinidadians and Tobagonians | 74.4 /100 | #159 | Good 19.8% |
| Pakistanis | 74.1 /100 | #160 | Good 19.8% |
| Immigrants | Belize | 74.1 /100 | #161 | Good 19.8% |
| French Canadians | 73.0 /100 | #162 | Good 19.9% |
| Malaysians | 72.7 /100 | #163 | Good 19.9% |
| Central Americans | 70.0 /100 | #164 | Good 19.9% |
| Eastern Europeans | 69.3 /100 | #165 | Good 19.9% |
| Belgians | 69.1 /100 | #166 | Good 19.9% |
Demographics Similar to Cambodians by Female Poverty Among 18-24 Year Olds
In terms of female poverty among 18-24 year olds, the demographic groups most similar to Cambodians are Paraguayan (19.4%, a difference of 0.010%), Immigrants from Chile (19.4%, a difference of 0.070%), Immigrants from Panama (19.4%, a difference of 0.14%), Guyanese (19.4%, a difference of 0.19%), and Immigrants from Russia (19.4%, a difference of 0.20%).
| Demographics | Rating | Rank | Female Poverty Among 18-24 Year Olds |
| Immigrants | Hungary | 96.2 /100 | #115 | Exceptional 19.3% |
| Immigrants | Immigrants | 95.9 /100 | #116 | Exceptional 19.3% |
| Immigrants | Iran | 95.8 /100 | #117 | Exceptional 19.3% |
| Immigrants | Guyana | 95.6 /100 | #118 | Exceptional 19.3% |
| Cypriots | 95.5 /100 | #119 | Exceptional 19.3% |
| Immigrants | Northern Europe | 95.4 /100 | #120 | Exceptional 19.4% |
| Guyanese | 95.3 /100 | #121 | Exceptional 19.4% |
| Cambodians | 94.6 /100 | #122 | Exceptional 19.4% |
| Paraguayans | 94.6 /100 | #123 | Exceptional 19.4% |
| Immigrants | Chile | 94.3 /100 | #124 | Exceptional 19.4% |
| Immigrants | Panama | 94.0 /100 | #125 | Exceptional 19.4% |
| Immigrants | Russia | 93.7 /100 | #126 | Exceptional 19.4% |
| Cape Verdeans | 93.6 /100 | #127 | Exceptional 19.4% |
| Slovaks | 92.9 /100 | #128 | Exceptional 19.5% |
| Immigrants | England | 92.9 /100 | #129 | Exceptional 19.5% |