Trinidadian and Tobagonian vs Immigrants from Costa Rica Female Poverty Among 18-24 Year Olds
COMPARE
Trinidadian and Tobagonian
Immigrants from Costa Rica
Female Poverty Among 18-24 Year Olds
Female Poverty Among 18-24 Year Olds Comparison
Trinidadians and Tobagonians
Immigrants from Costa Rica
19.8%
FEMALE POVERTY AMONG 18-24 YEAR OLDS
74.4/ 100
METRIC RATING
159th/ 347
METRIC RANK
18.7%
FEMALE POVERTY AMONG 18-24 YEAR OLDS
99.7/ 100
METRIC RATING
70th/ 347
METRIC RANK
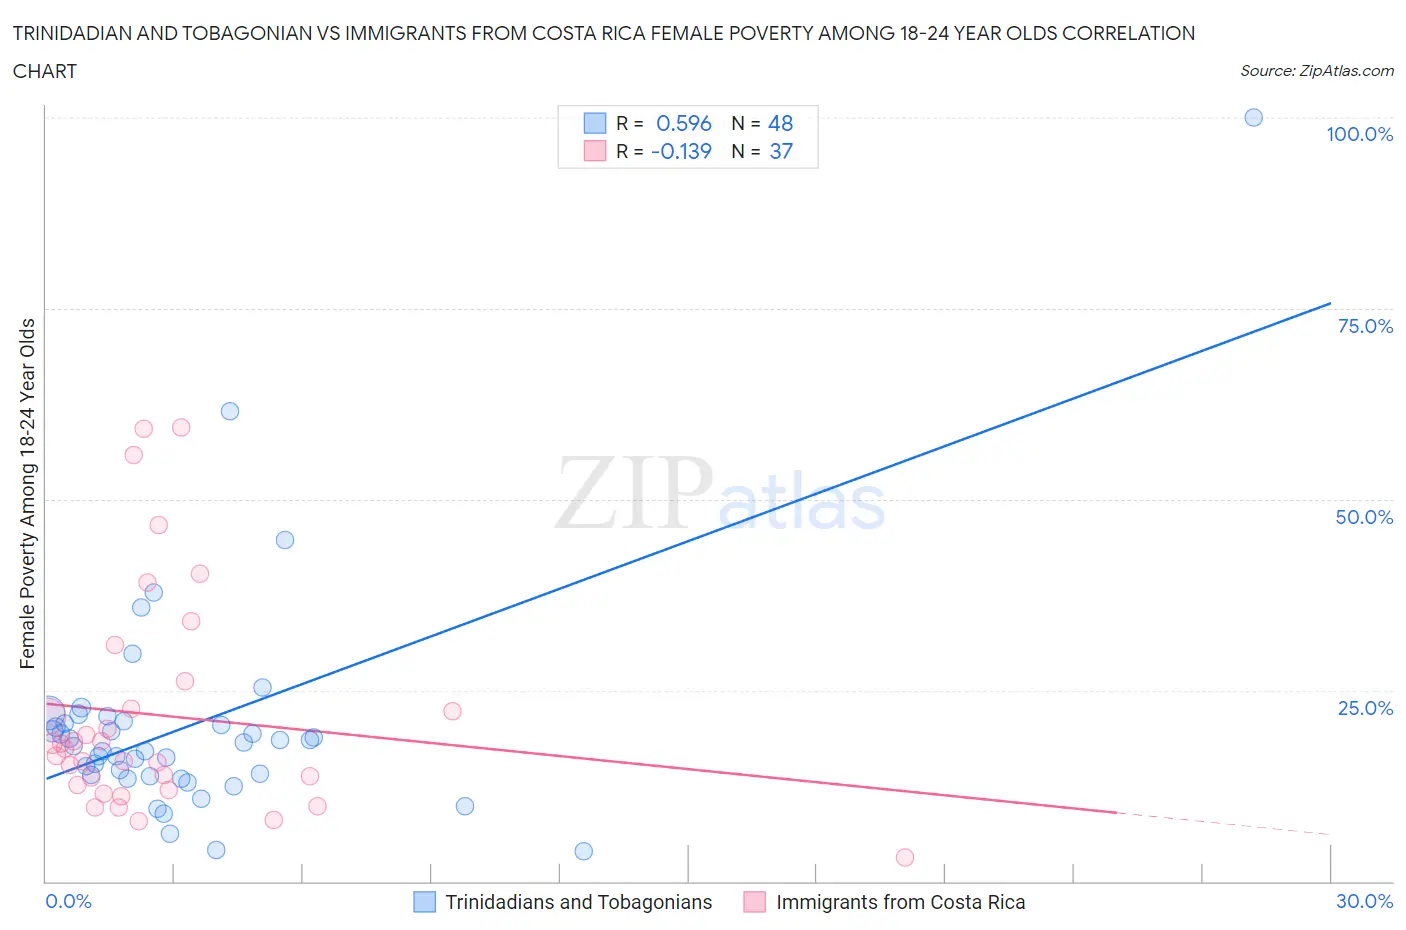
Trinidadian and Tobagonian vs Immigrants from Costa Rica Female Poverty Among 18-24 Year Olds Correlation Chart
The statistical analysis conducted on geographies consisting of 216,840,650 people shows a substantial positive correlation between the proportion of Trinidadians and Tobagonians and poverty level among females between the ages 18 and 24 in the United States with a correlation coefficient (R) of 0.596 and weighted average of 19.8%. Similarly, the statistical analysis conducted on geographies consisting of 202,109,997 people shows a poor negative correlation between the proportion of Immigrants from Costa Rica and poverty level among females between the ages 18 and 24 in the United States with a correlation coefficient (R) of -0.139 and weighted average of 18.7%, a difference of 6.3%.
Female Poverty Among 18-24 Year Olds Correlation Summary
| Measurement | Trinidadian and Tobagonian | Immigrants from Costa Rica |
| Minimum | 3.9% | 3.1% |
| Maximum | 100.0% | 59.4% |
| Range | 96.1% | 56.3% |
| Mean | 20.5% | 21.7% |
| Median | 17.9% | 17.3% |
| Interquartile 25% (IQ1) | 13.8% | 12.3% |
| Interquartile 75% (IQ3) | 20.7% | 24.4% |
| Interquartile Range (IQR) | 6.9% | 12.1% |
| Standard Deviation (Sample) | 15.3% | 14.4% |
| Standard Deviation (Population) | 15.2% | 14.2% |
Similar Demographics by Female Poverty Among 18-24 Year Olds
Demographics Similar to Trinidadians and Tobagonians by Female Poverty Among 18-24 Year Olds
In terms of female poverty among 18-24 year olds, the demographic groups most similar to Trinidadians and Tobagonians are Pakistani (19.8%, a difference of 0.020%), Immigrants from Belize (19.8%, a difference of 0.020%), Immigrants from Lebanon (19.8%, a difference of 0.060%), Danish (19.8%, a difference of 0.070%), and French Canadian (19.9%, a difference of 0.090%).
| Demographics | Rating | Rank | Female Poverty Among 18-24 Year Olds |
| Yugoslavians | 79.0 /100 | #152 | Good 19.8% |
| Immigrants | Japan | 78.1 /100 | #153 | Good 19.8% |
| Immigrants | Zimbabwe | 76.7 /100 | #154 | Good 19.8% |
| Hungarians | 76.6 /100 | #155 | Good 19.8% |
| Immigrants | Belgium | 76.4 /100 | #156 | Good 19.8% |
| Danes | 75.5 /100 | #157 | Good 19.8% |
| Immigrants | Lebanon | 75.3 /100 | #158 | Good 19.8% |
| Trinidadians and Tobagonians | 74.4 /100 | #159 | Good 19.8% |
| Pakistanis | 74.1 /100 | #160 | Good 19.8% |
| Immigrants | Belize | 74.1 /100 | #161 | Good 19.8% |
| French Canadians | 73.0 /100 | #162 | Good 19.9% |
| Malaysians | 72.7 /100 | #163 | Good 19.9% |
| Central Americans | 70.0 /100 | #164 | Good 19.9% |
| Eastern Europeans | 69.3 /100 | #165 | Good 19.9% |
| Belgians | 69.1 /100 | #166 | Good 19.9% |
Demographics Similar to Immigrants from Costa Rica by Female Poverty Among 18-24 Year Olds
In terms of female poverty among 18-24 year olds, the demographic groups most similar to Immigrants from Costa Rica are Immigrants from Haiti (18.7%, a difference of 0.060%), Armenian (18.7%, a difference of 0.090%), Immigrants from Bulgaria (18.6%, a difference of 0.11%), Lithuanian (18.7%, a difference of 0.12%), and Brazilian (18.6%, a difference of 0.22%).
| Demographics | Rating | Rank | Female Poverty Among 18-24 Year Olds |
| Immigrants | Belarus | 99.8 /100 | #63 | Exceptional 18.5% |
| Immigrants | Asia | 99.8 /100 | #64 | Exceptional 18.6% |
| Immigrants | Scotland | 99.8 /100 | #65 | Exceptional 18.6% |
| Jordanians | 99.8 /100 | #66 | Exceptional 18.6% |
| Immigrants | Korea | 99.8 /100 | #67 | Exceptional 18.6% |
| Brazilians | 99.8 /100 | #68 | Exceptional 18.6% |
| Immigrants | Bulgaria | 99.7 /100 | #69 | Exceptional 18.6% |
| Immigrants | Costa Rica | 99.7 /100 | #70 | Exceptional 18.7% |
| Immigrants | Haiti | 99.7 /100 | #71 | Exceptional 18.7% |
| Armenians | 99.7 /100 | #72 | Exceptional 18.7% |
| Lithuanians | 99.7 /100 | #73 | Exceptional 18.7% |
| Hawaiians | 99.6 /100 | #74 | Exceptional 18.7% |
| Poles | 99.6 /100 | #75 | Exceptional 18.8% |
| Immigrants | Cambodia | 99.5 /100 | #76 | Exceptional 18.8% |
| Costa Ricans | 99.5 /100 | #77 | Exceptional 18.8% |