Trinidadian and Tobagonian vs Immigrants from Latvia Female Poverty Among 18-24 Year Olds
COMPARE
Trinidadian and Tobagonian
Immigrants from Latvia
Female Poverty Among 18-24 Year Olds
Female Poverty Among 18-24 Year Olds Comparison
Trinidadians and Tobagonians
Immigrants from Latvia
19.8%
FEMALE POVERTY AMONG 18-24 YEAR OLDS
74.4/ 100
METRIC RATING
159th/ 347
METRIC RANK
20.4%
FEMALE POVERTY AMONG 18-24 YEAR OLDS
23.0/ 100
METRIC RATING
195th/ 347
METRIC RANK
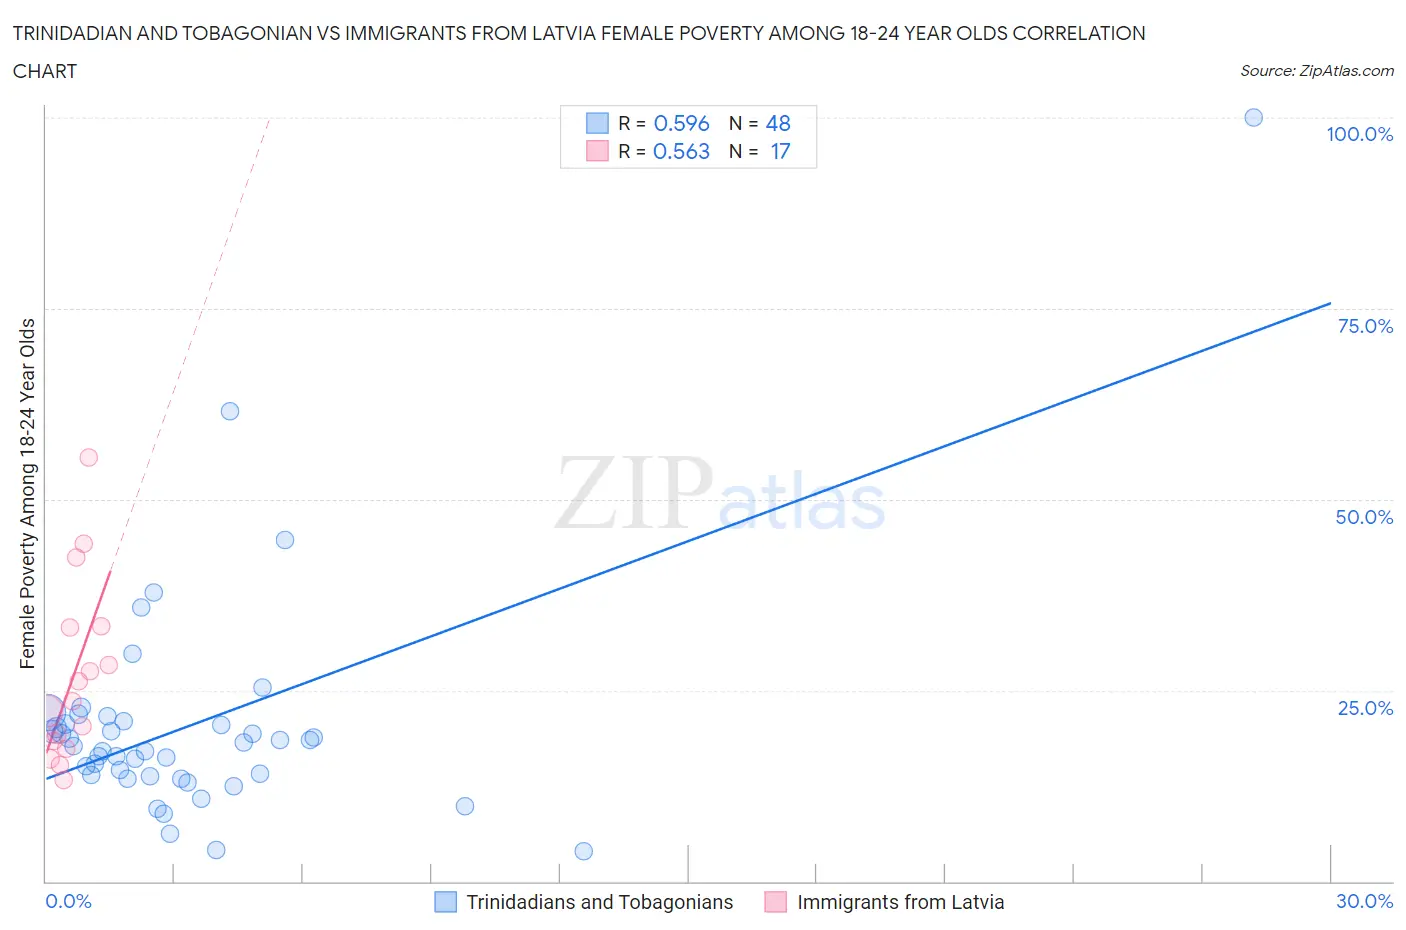
Trinidadian and Tobagonian vs Immigrants from Latvia Female Poverty Among 18-24 Year Olds Correlation Chart
The statistical analysis conducted on geographies consisting of 216,840,650 people shows a substantial positive correlation between the proportion of Trinidadians and Tobagonians and poverty level among females between the ages 18 and 24 in the United States with a correlation coefficient (R) of 0.596 and weighted average of 19.8%. Similarly, the statistical analysis conducted on geographies consisting of 112,426,686 people shows a substantial positive correlation between the proportion of Immigrants from Latvia and poverty level among females between the ages 18 and 24 in the United States with a correlation coefficient (R) of 0.563 and weighted average of 20.4%, a difference of 2.8%.
Female Poverty Among 18-24 Year Olds Correlation Summary
| Measurement | Trinidadian and Tobagonian | Immigrants from Latvia |
| Minimum | 3.9% | 13.2% |
| Maximum | 100.0% | 55.5% |
| Range | 96.1% | 42.3% |
| Mean | 20.5% | 26.8% |
| Median | 17.9% | 23.5% |
| Interquartile 25% (IQ1) | 13.8% | 17.9% |
| Interquartile 75% (IQ3) | 20.7% | 33.3% |
| Interquartile Range (IQR) | 6.9% | 15.4% |
| Standard Deviation (Sample) | 15.3% | 11.7% |
| Standard Deviation (Population) | 15.2% | 11.3% |
Similar Demographics by Female Poverty Among 18-24 Year Olds
Demographics Similar to Trinidadians and Tobagonians by Female Poverty Among 18-24 Year Olds
In terms of female poverty among 18-24 year olds, the demographic groups most similar to Trinidadians and Tobagonians are Pakistani (19.8%, a difference of 0.020%), Immigrants from Belize (19.8%, a difference of 0.020%), Immigrants from Lebanon (19.8%, a difference of 0.060%), Danish (19.8%, a difference of 0.070%), and French Canadian (19.9%, a difference of 0.090%).
| Demographics | Rating | Rank | Female Poverty Among 18-24 Year Olds |
| Yugoslavians | 79.0 /100 | #152 | Good 19.8% |
| Immigrants | Japan | 78.1 /100 | #153 | Good 19.8% |
| Immigrants | Zimbabwe | 76.7 /100 | #154 | Good 19.8% |
| Hungarians | 76.6 /100 | #155 | Good 19.8% |
| Immigrants | Belgium | 76.4 /100 | #156 | Good 19.8% |
| Danes | 75.5 /100 | #157 | Good 19.8% |
| Immigrants | Lebanon | 75.3 /100 | #158 | Good 19.8% |
| Trinidadians and Tobagonians | 74.4 /100 | #159 | Good 19.8% |
| Pakistanis | 74.1 /100 | #160 | Good 19.8% |
| Immigrants | Belize | 74.1 /100 | #161 | Good 19.8% |
| French Canadians | 73.0 /100 | #162 | Good 19.9% |
| Malaysians | 72.7 /100 | #163 | Good 19.9% |
| Central Americans | 70.0 /100 | #164 | Good 19.9% |
| Eastern Europeans | 69.3 /100 | #165 | Good 19.9% |
| Belgians | 69.1 /100 | #166 | Good 19.9% |
Demographics Similar to Immigrants from Latvia by Female Poverty Among 18-24 Year Olds
In terms of female poverty among 18-24 year olds, the demographic groups most similar to Immigrants from Latvia are Mexican American Indian (20.4%, a difference of 0.010%), Nigerian (20.4%, a difference of 0.030%), Czech (20.4%, a difference of 0.050%), Immigrants from Israel (20.4%, a difference of 0.10%), and Zimbabwean (20.4%, a difference of 0.14%).
| Demographics | Rating | Rank | Female Poverty Among 18-24 Year Olds |
| Scandinavians | 34.6 /100 | #188 | Fair 20.3% |
| Immigrants | Germany | 34.0 /100 | #189 | Fair 20.3% |
| Immigrants | Western Asia | 29.3 /100 | #190 | Fair 20.3% |
| Moroccans | 25.8 /100 | #191 | Fair 20.4% |
| Immigrants | Israel | 24.4 /100 | #192 | Fair 20.4% |
| Nigerians | 23.4 /100 | #193 | Fair 20.4% |
| Mexican American Indians | 23.2 /100 | #194 | Fair 20.4% |
| Immigrants | Latvia | 23.0 /100 | #195 | Fair 20.4% |
| Czechs | 22.3 /100 | #196 | Fair 20.4% |
| Zimbabweans | 21.0 /100 | #197 | Fair 20.4% |
| Immigrants | Spain | 20.7 /100 | #198 | Fair 20.4% |
| Germans | 20.6 /100 | #199 | Fair 20.4% |
| Europeans | 19.9 /100 | #200 | Poor 20.4% |
| Mexicans | 18.3 /100 | #201 | Poor 20.5% |
| Immigrants | Turkey | 17.7 /100 | #202 | Poor 20.5% |